

Behind the Scenes of AI Observability in Production
What actually works after 6 months of trial and error

Welcome to the AI Evals & Observability series: A 7-part journey from shipping AI apps to systematically improving them. Made by busy people. For busy people.
🧐 Everyone says you need AI evals. Few explain how to actually build them and answer questions such as…
How do we avoid creating evals that waste our time and resources? How do we build datasets and design evaluators that matter? How do we adapt them for RAG? ...and most importantly, how do we stop “vibe checking” and leverage evals to actually track and optimize our app?
This 7-article series breaks it all down from first principles:
Lessons from 6 Months of Evals on a Production AI Companion ← You are here
By the end, you’ll know how to integrate AI evals that actually track and improve the performance of your AI product. No vibe checking required!
Let’s get started.
Lessons from 6 Months of Evals on a Production AI Companion
Paul: Today, the stage belongs to Alejandro Aboy, Senior Data Engineer at Workpath. Alejandro owns the entire data stack and is the architect behind the Workpath AI Companion.
When he isn’t shipping, he’s sharing engineering deep-dives at his publication, The Pipe & The Line.
Enough chitchat. Let’s get into it 👀 ↓
Alejandro: Over the last year, I’ve been working on different agent projects, but one took most of the attention.
We are talking about the main AI feature of the company SaaS, the companion that guides you through everything you can do and can also do it for you.
It can call around 50 different tools, do RAG searches based on documentation and also save workflows in memory so you don’t have to start from scratch. It can even get contextual messages from the frontend to know what you see when you see it on the platform.
As you can imagine, there’s a lot it can happen when you give too much power to Agents. These are some of the things I noticed:
Agent complies with formatting but hallucinates documentation links after fake searching the docs
Agent infers the wrong user information and makes the wrong tool calls or argues no information can be found
Agent suggests follow up with actions that are outside scope, like running tool calls that don’t exist
There are lots of Agent demos out there, and 2026 won’t stop the hype probably, but we barely discuss these nuances and how to address them in production environments to keep improving our Agents with awareness of what’s happening after we do a prompt change or add a new tool.
To address that, here is what we will learn in this article:
Problems with AI Observability
Falling For Classic Metrics Or Trying To Define What’s “Good” or “Bad”
Not Going Through Manual Annotations
Not Treating Your AI Agents As A Data Product
Implementing AI Observability
Opik Overview
Opik MCP Server
Figuring Out Evaluation Criteria
Refining Evaluation Criteria
Running Annotation Sessions
Making Sense Of Annotated Feedback
Backstory Of This Framework
But first, a quick word from our sponsor, Opik ↓
Opik: Open-Source LLMOps Platform (Sponsored)
This AI Evals & Observability series is brought to you by Opik, the LLMOps open-source platform used by Uber, Etsy, Netflix, and more.
But most importantly, we are incredibly grateful to be supported by a tool that we personally love and keep returning to for all our open-source courses and real-world AI products. Why? Because it makes escaping the PoC purgatory possible!

Here is how Opik helps us ship AI workflows and agents to production:
We see everything - Visualize complete traces of LLM calls, including costs and latency breakdowns at each reasoning step.
Easily optimize our system - Measure our performance using custom LLM judges, run experiments, compare results and pick the best configuration.
Catch issues quickly - Plug in the LLM Judge metrics into production traces and receive on-demand alarms.
Stop manual prompt engineering - Their prompt versioning and optimization features allow us to track and improve our system automatically. The future of AutoAI.
Opik is fully open-source and works with custom code or most AI frameworks. You can also use the managed version for free (w/ 25K spans/month on their generous free tier).
↓ Now, let’s move back to the article.
Problems With AI Observability
As mentioned, there are many things you don’t see on how you Agent is working, and depending on usage and scale, you are likely to miss most of them.
The problem won’t be gone by reviewing everything manually or finding the perfect sample to evaluate.
There are some problems I learned about while implementing it at work. These have been mentioned by great experts on the topic, but I summarised how I experienced them like this:
Falling for Classic Metrics or Trying to Define What’s “Good” or “Bad”
Tools like Opik or Langfuse come by usual metrics out of the box Usual metrics cover Hallucination, AnswerRelevance, ContextPrecision and ContextRecall.
You can configure them and start evaluating right away, but we you get that the hallucination score is 1, then what?
You need to find what to evaluate to improve your use case, otherwise you can’t really improve it.
By this point, if you used LLMs for anything, you might have learn about determinism and its nuances. You can run the same thing over and over and get different outputs.
Same with evaluations; you need to find a standard way of evaluating without struggling with ambiguity every single time.
That’s why trying to evaluate nuances and all flavours of a metric might cause confusion.
You need to keep it lean, the best test is asking different people what they think and if they answer the same, you got a good metric.
For example, I wanted to evaluate if the agent was hallucinating documentation links. My evaluation task was: Check if
search_knowledgetool was called and verify if the URL in the output matches the tool output the agent used. That’s binary and can’t be misinterpreted even if you run the LLM As Judge multiple times.
Not Going Through Manual Annotations
Unfortunately you can’t get away with murder without reviewing Agent responses manually.
If you automate 100% of those reviews with LLM as Judge you are likely to miss the substance because LLMs might hide interesting finding behind isolated prompts that could be phrased badly.
For example, all my metric scores were doing mostly fine, but when I started seeing some conversations manually I noticed the agent suggesting things it can do at all, or answering things outside scope. That surface more evaluation opportunities, but also more things to add to the backlog that we could not see otherwise.
With all the MCP servers out there, you can easily cluster all the manual feedback you collected and prepare documents for further analysis, so there’s no excuse for “who will review all these manual comments later”?
Not Treating Your AI Agents as a Data Product
The worst mistake someone can do is just evaluating an AI Agent and not take anything out of it besides good or bad metric scores.
Each conversation its writing an invisible roadmap you need to materialise.
Whether if its a JIRA ticket to address a bug, or a new feature development plan for a brand new Agent capability.
I personally developed a lot of Product Analytics use cases to cover for internal analytics done by CS teams, which allowed a lot of reverse engineering to discover new use cases.
If you just create synthetic data to evaluate a prompt and leave observability at that point, you are missing out on real production data that can scream improvements right to your face.
So shift your mindset and own the process to define the success of each one of your AI Agent projects ;)
Recommended:
Implementing AI Observability
In the upcoming sections of this article, we will talk about Opik, but these fundamentals are relevant for any other observability tool.
It’s quite common in Software Engineering to use tools such as Sentry for error logging.
Opik Overview
Tools like Opik follow the same principles: traces & spans.
You trace every single LLM interaction (trace), whether is an AI Agent or just a simple LLM call you want to audit.
You can break it down to see every thing that got used along the way (span), which translate into agent tools, such as retrieving documents with RAG.
All traces are grouped into threads, which equal to a chat or conversation putting messages together. When reviewing LLMs, it’s relevant to look at the thread level to get a grasp of how it worked considering the full context.
Beyond the trace <> span pair we talked about, with Opik you can:
Do prompt versioning, which comes in handy to associate metric scores evolving after a particular prompt version.
Connect your AI provider (OpenAI, Anthropic, Azure, etc) in order to run Online Evaluations every time a new trace comes in, so you get fresh metrics on how your Agent is working on production.
Use its SDK & REST API to scale any of its processes, from trace processing to running on demand evaluations using LLMs.
I am just scratching the surface here, you can do a lot more and I encourage you to take a look!
Recommended:
Opik MCP Server
Using the MCP Server is optional as any other MCP, but I found it super powerful to do things that would have take me weeks or even months.
I found ways of leveraging to coming up with metric ideas based on my prompts and traces data, also picking up comments to quickly write documentation to review for potential product roadmaps.
You can get creative pretty easily and I invite you to try it.
Take a look on Github - opik-mcp to get started.
For the upcoming sections we will be using some slash commands that wrap some workflows to enhance the annotation process to make it more streamlined and enriched.
You can find them here: Opik MCP Commands
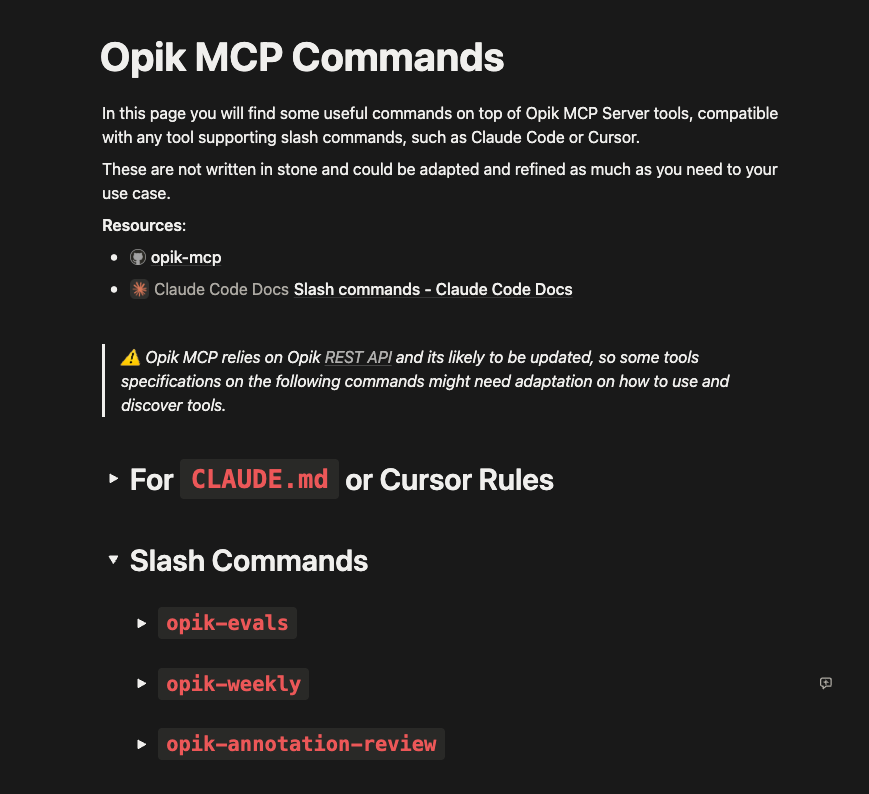
⚠️ Disclaimer: Opik MCP tools return a bunch of data. You are likely to see this message “⚠ Large MCP response (~10.6k tokens), this can fill up context quickly”.
The
CLAUDE.mdinstructions are meant to tell the LLM how to use tool calling to sample data gradually to avoid filling up the context quite quickly. The ideal workflow is too sample some threads and keep going as needed and saving checkpoints of the analysis to .md files for future reference.
Figuring Out Evaluation Criteria
On Opik, you can run evaluations on the trace or thread levels, this means you can evaluate the single turn (user message > agent message) or multi turn interactions.
But first we need to understand what our Agent is actually doing.
If we don’t know the use cases its covering, its really hard to know how to evaluate it accordingly.
Note: All these commands are useful with real production traces, not synthetic data. You want to know what the agent is being used for, not what you want it to be used for.
To achieve this, you need a prompt created on Opik so you can use Claude Code or Cursor to reverse engineer it to figure what are the best evaluation criteria principles to cluster.
When you run opik-eval you get something like this:
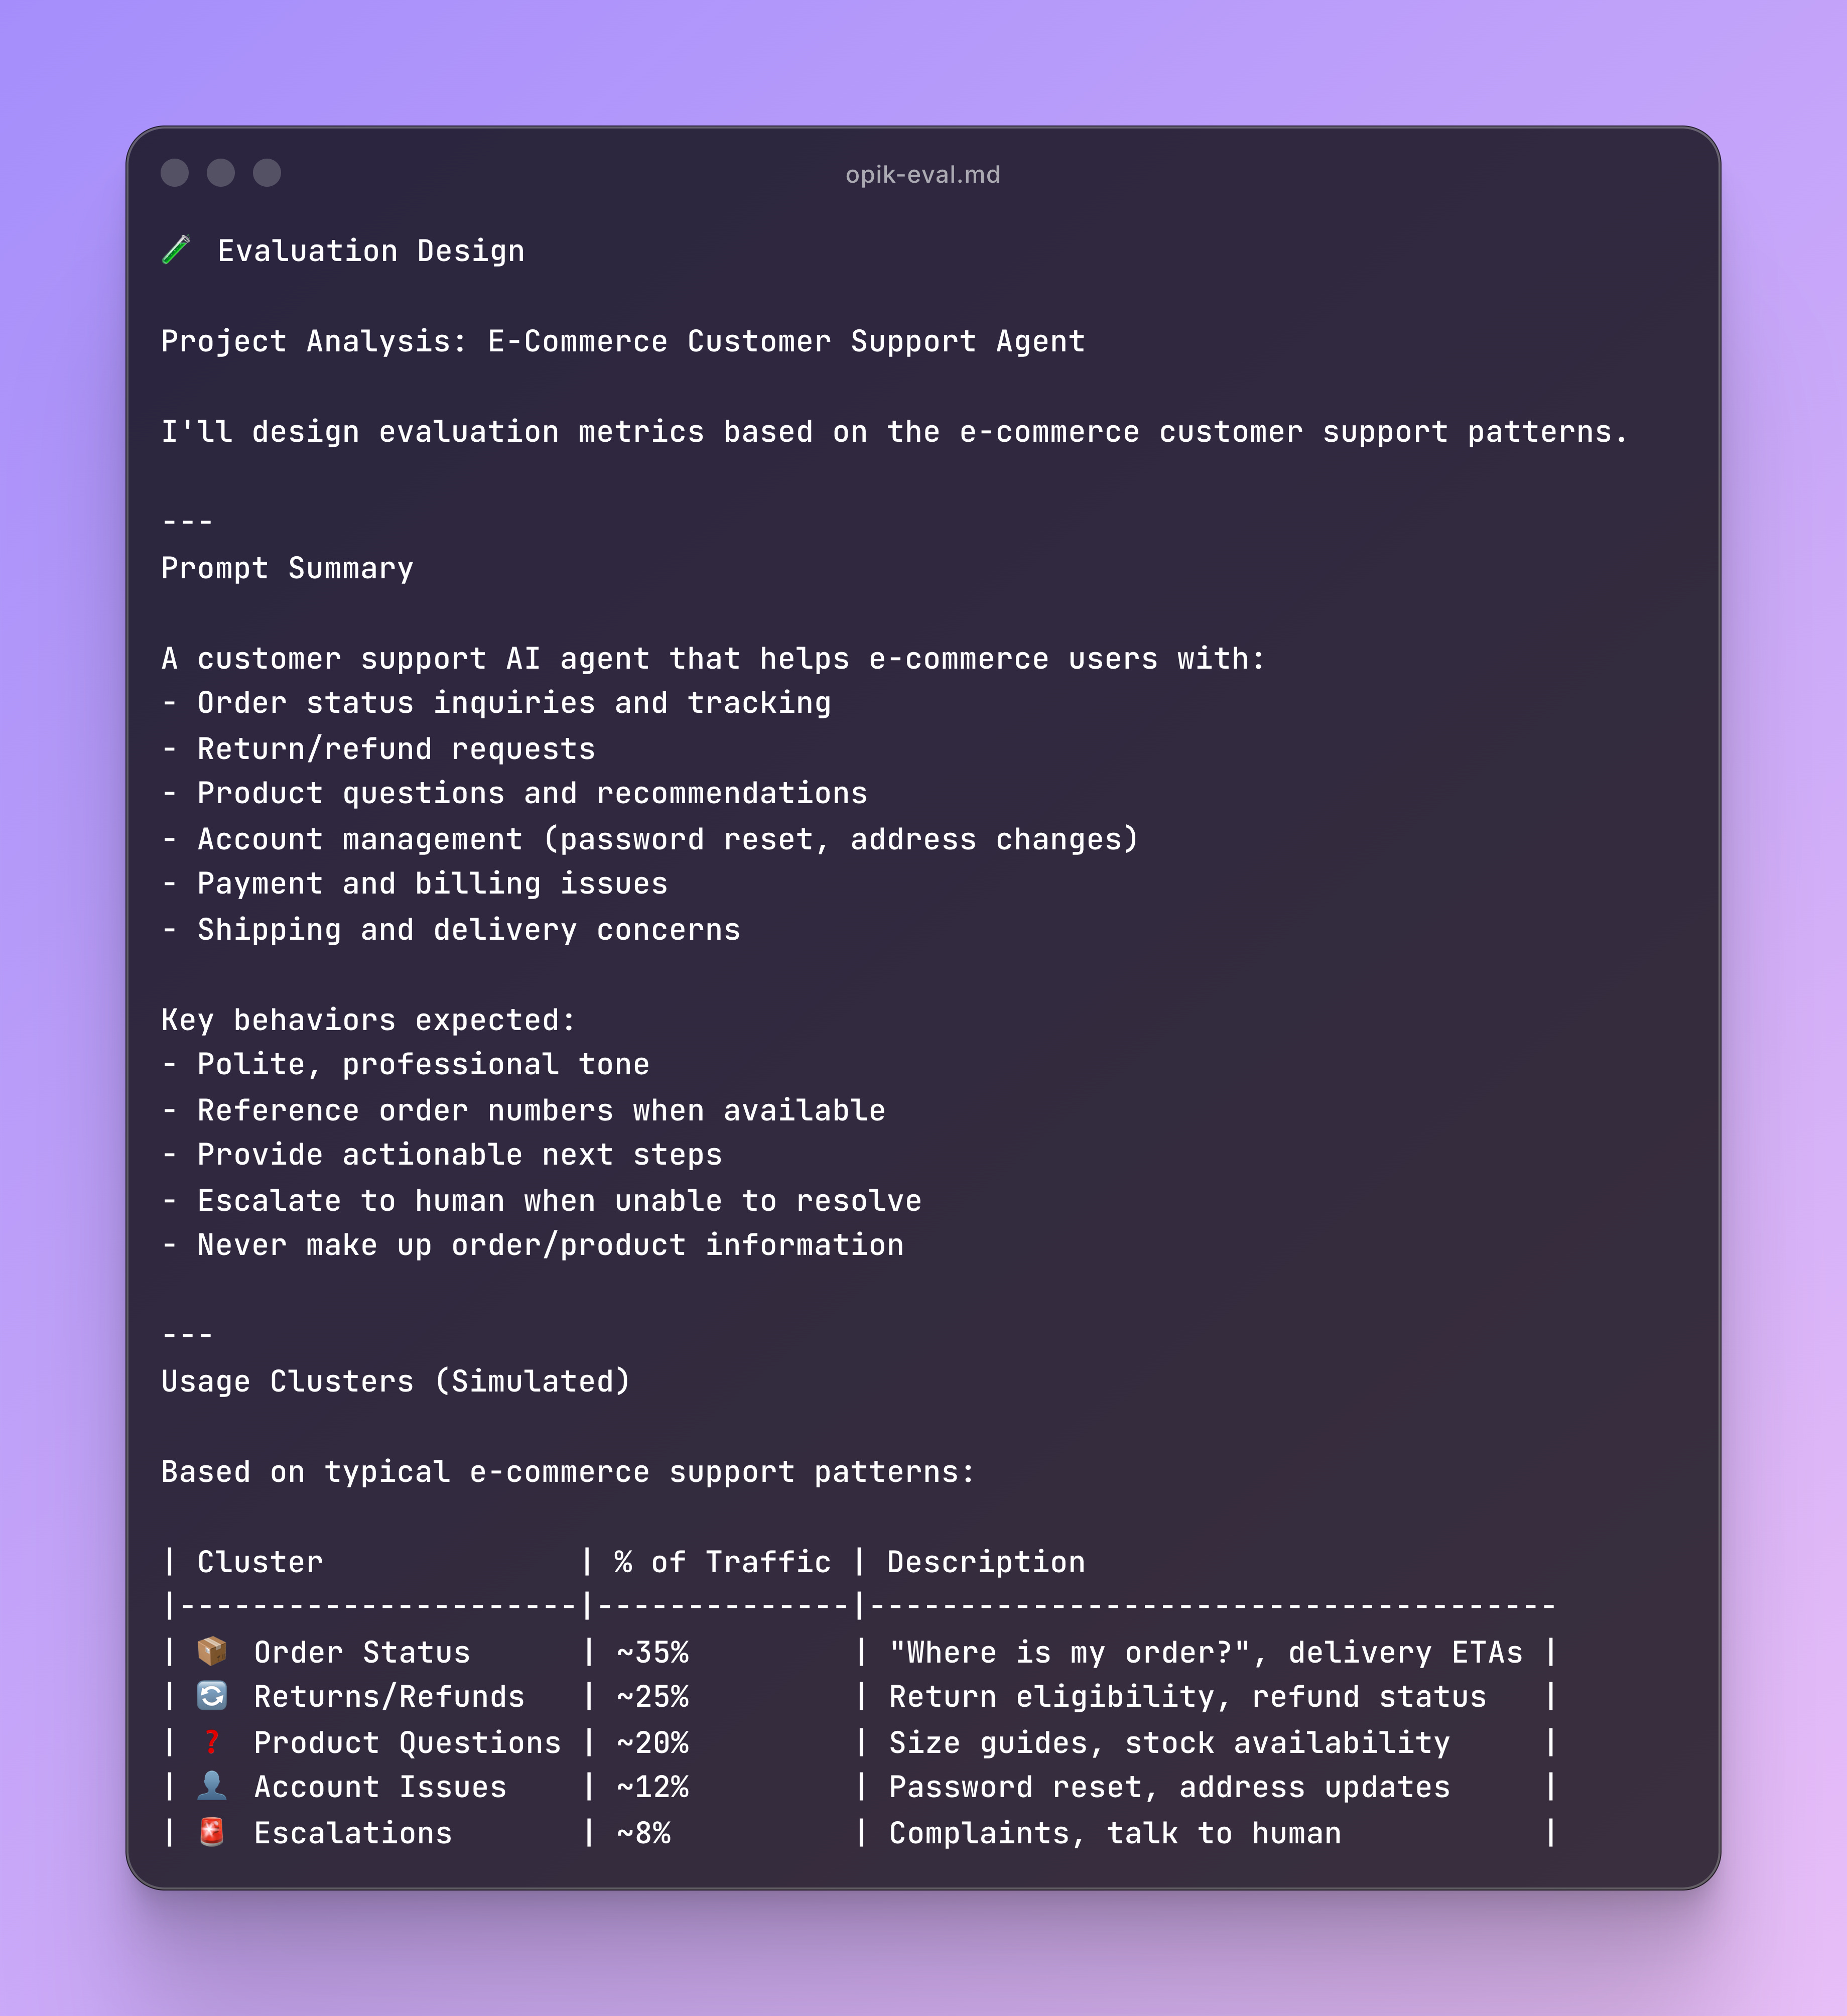
Now that you have your prompt fully analysed, you will proceed to break it down on how to evaluate it based on usage.
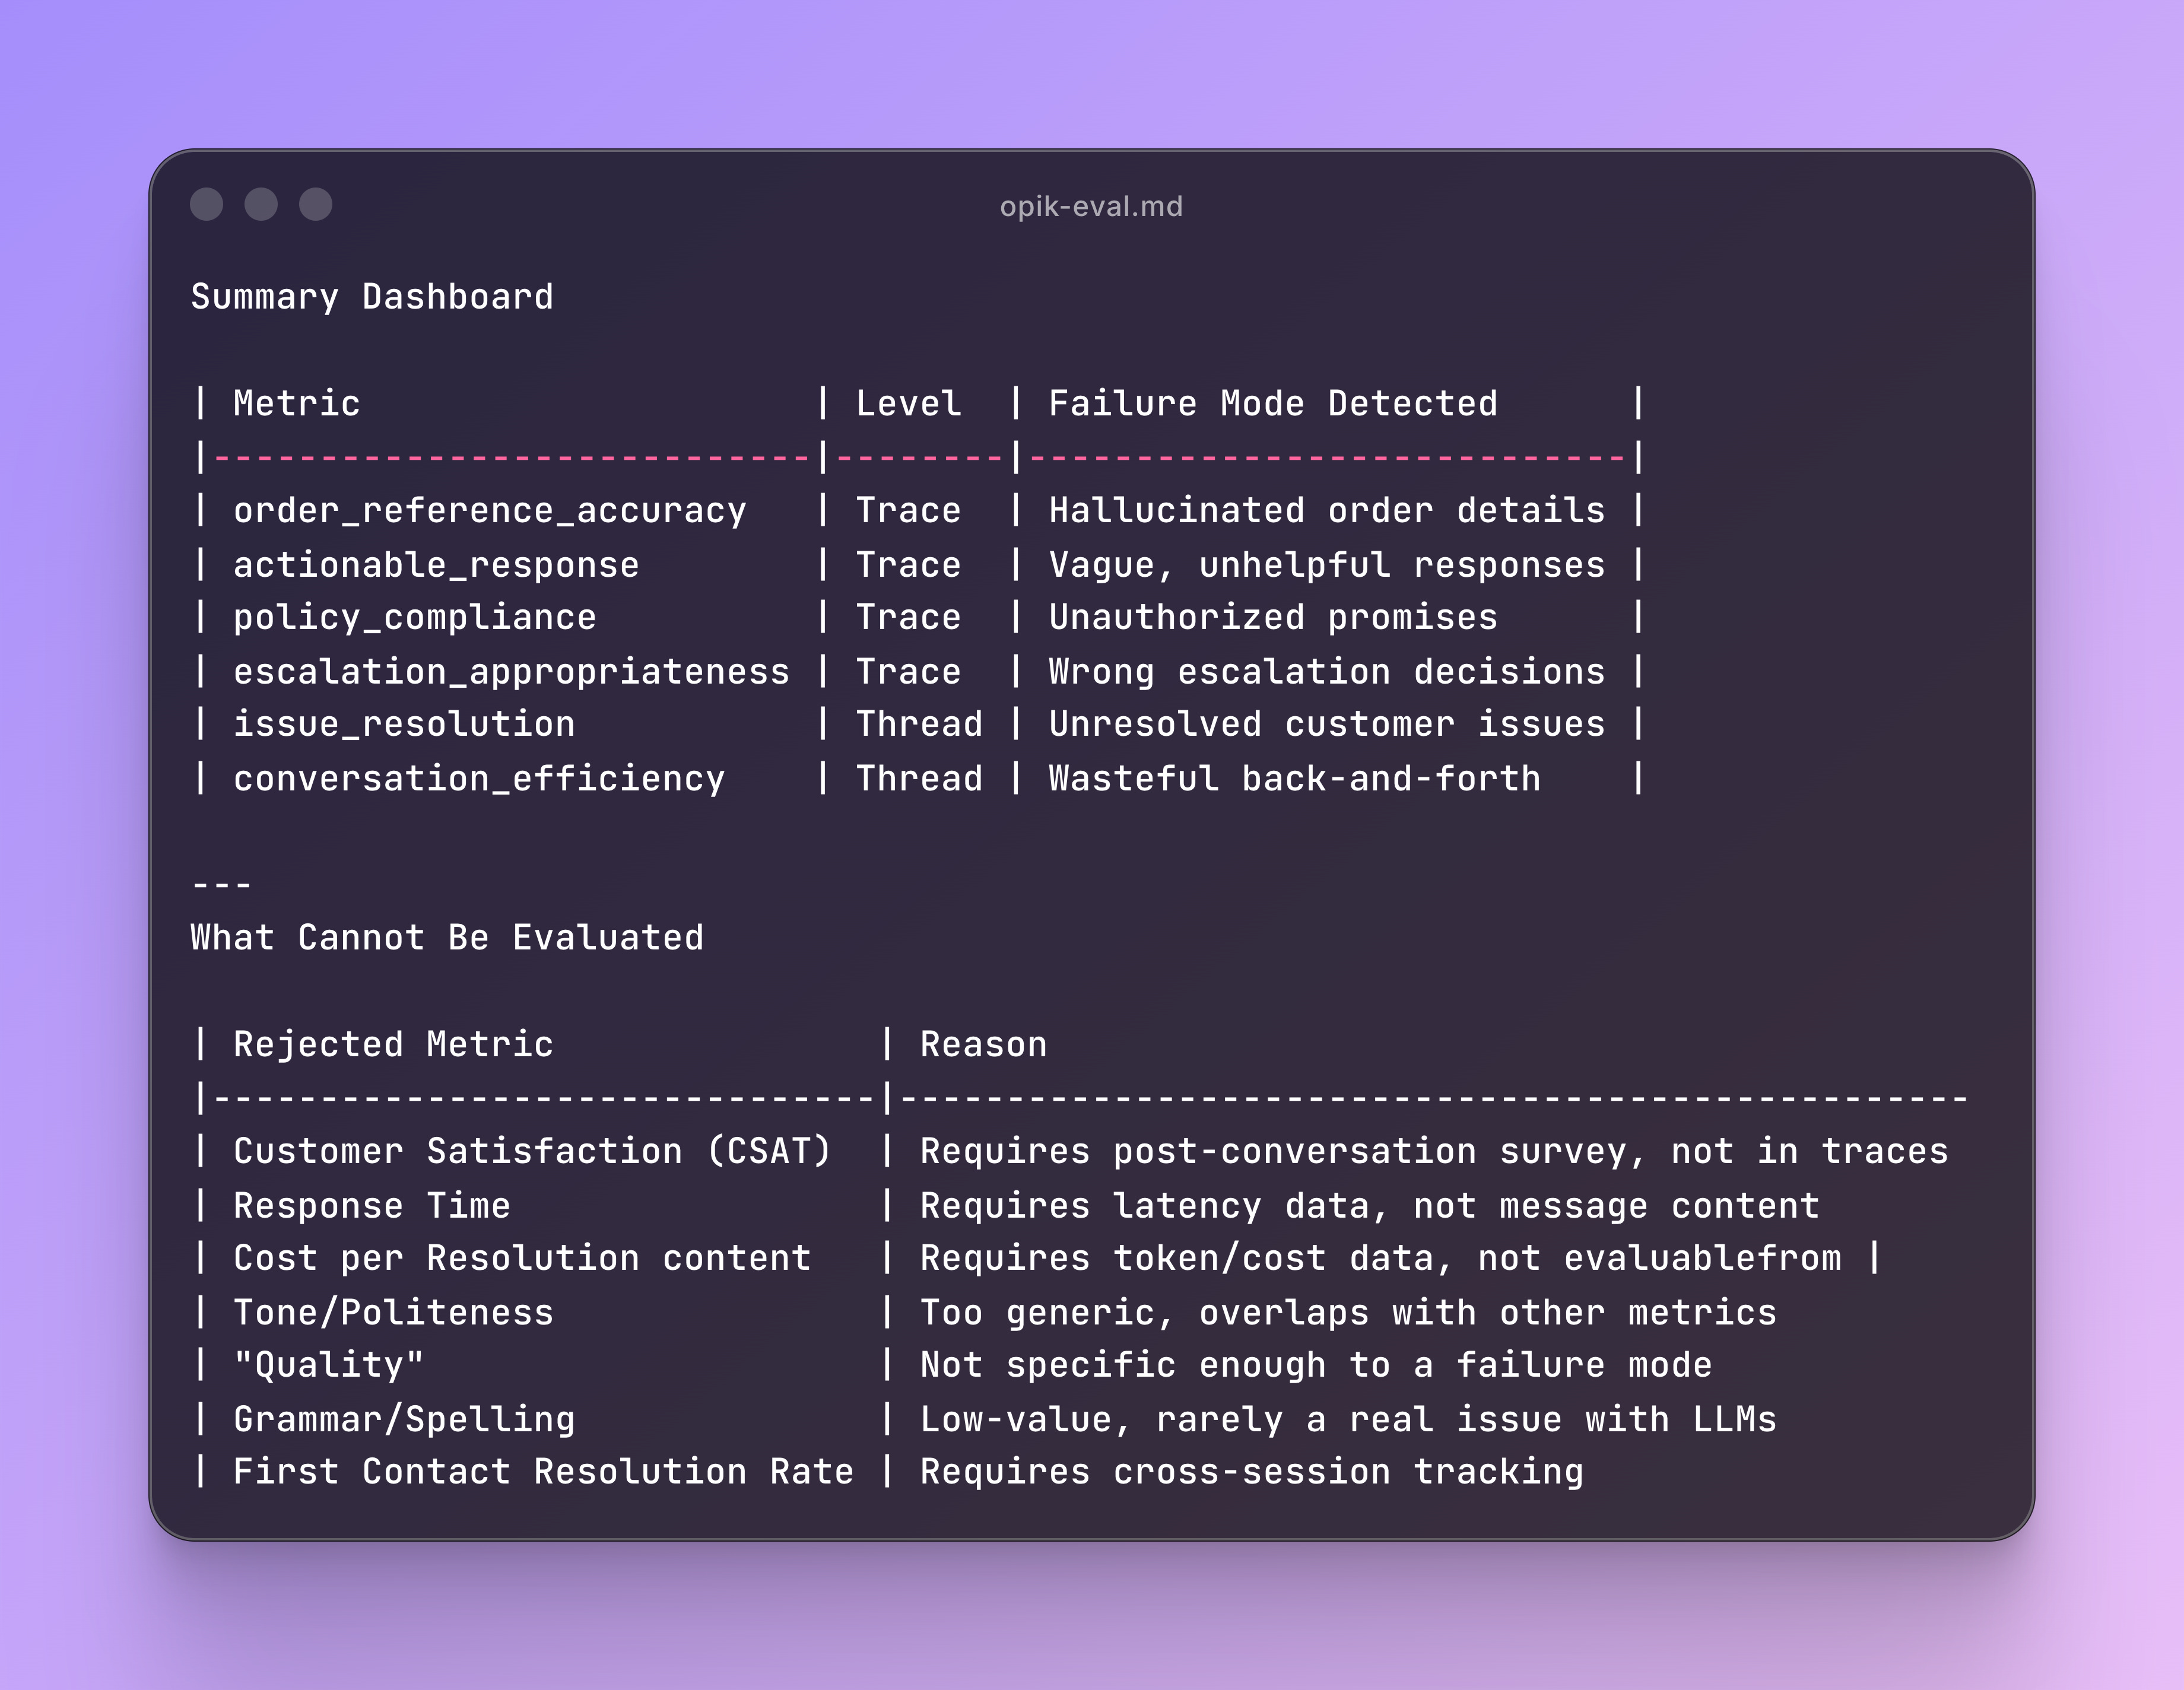
Then it will propose metrics for Trace and Thread levels, looking like this:
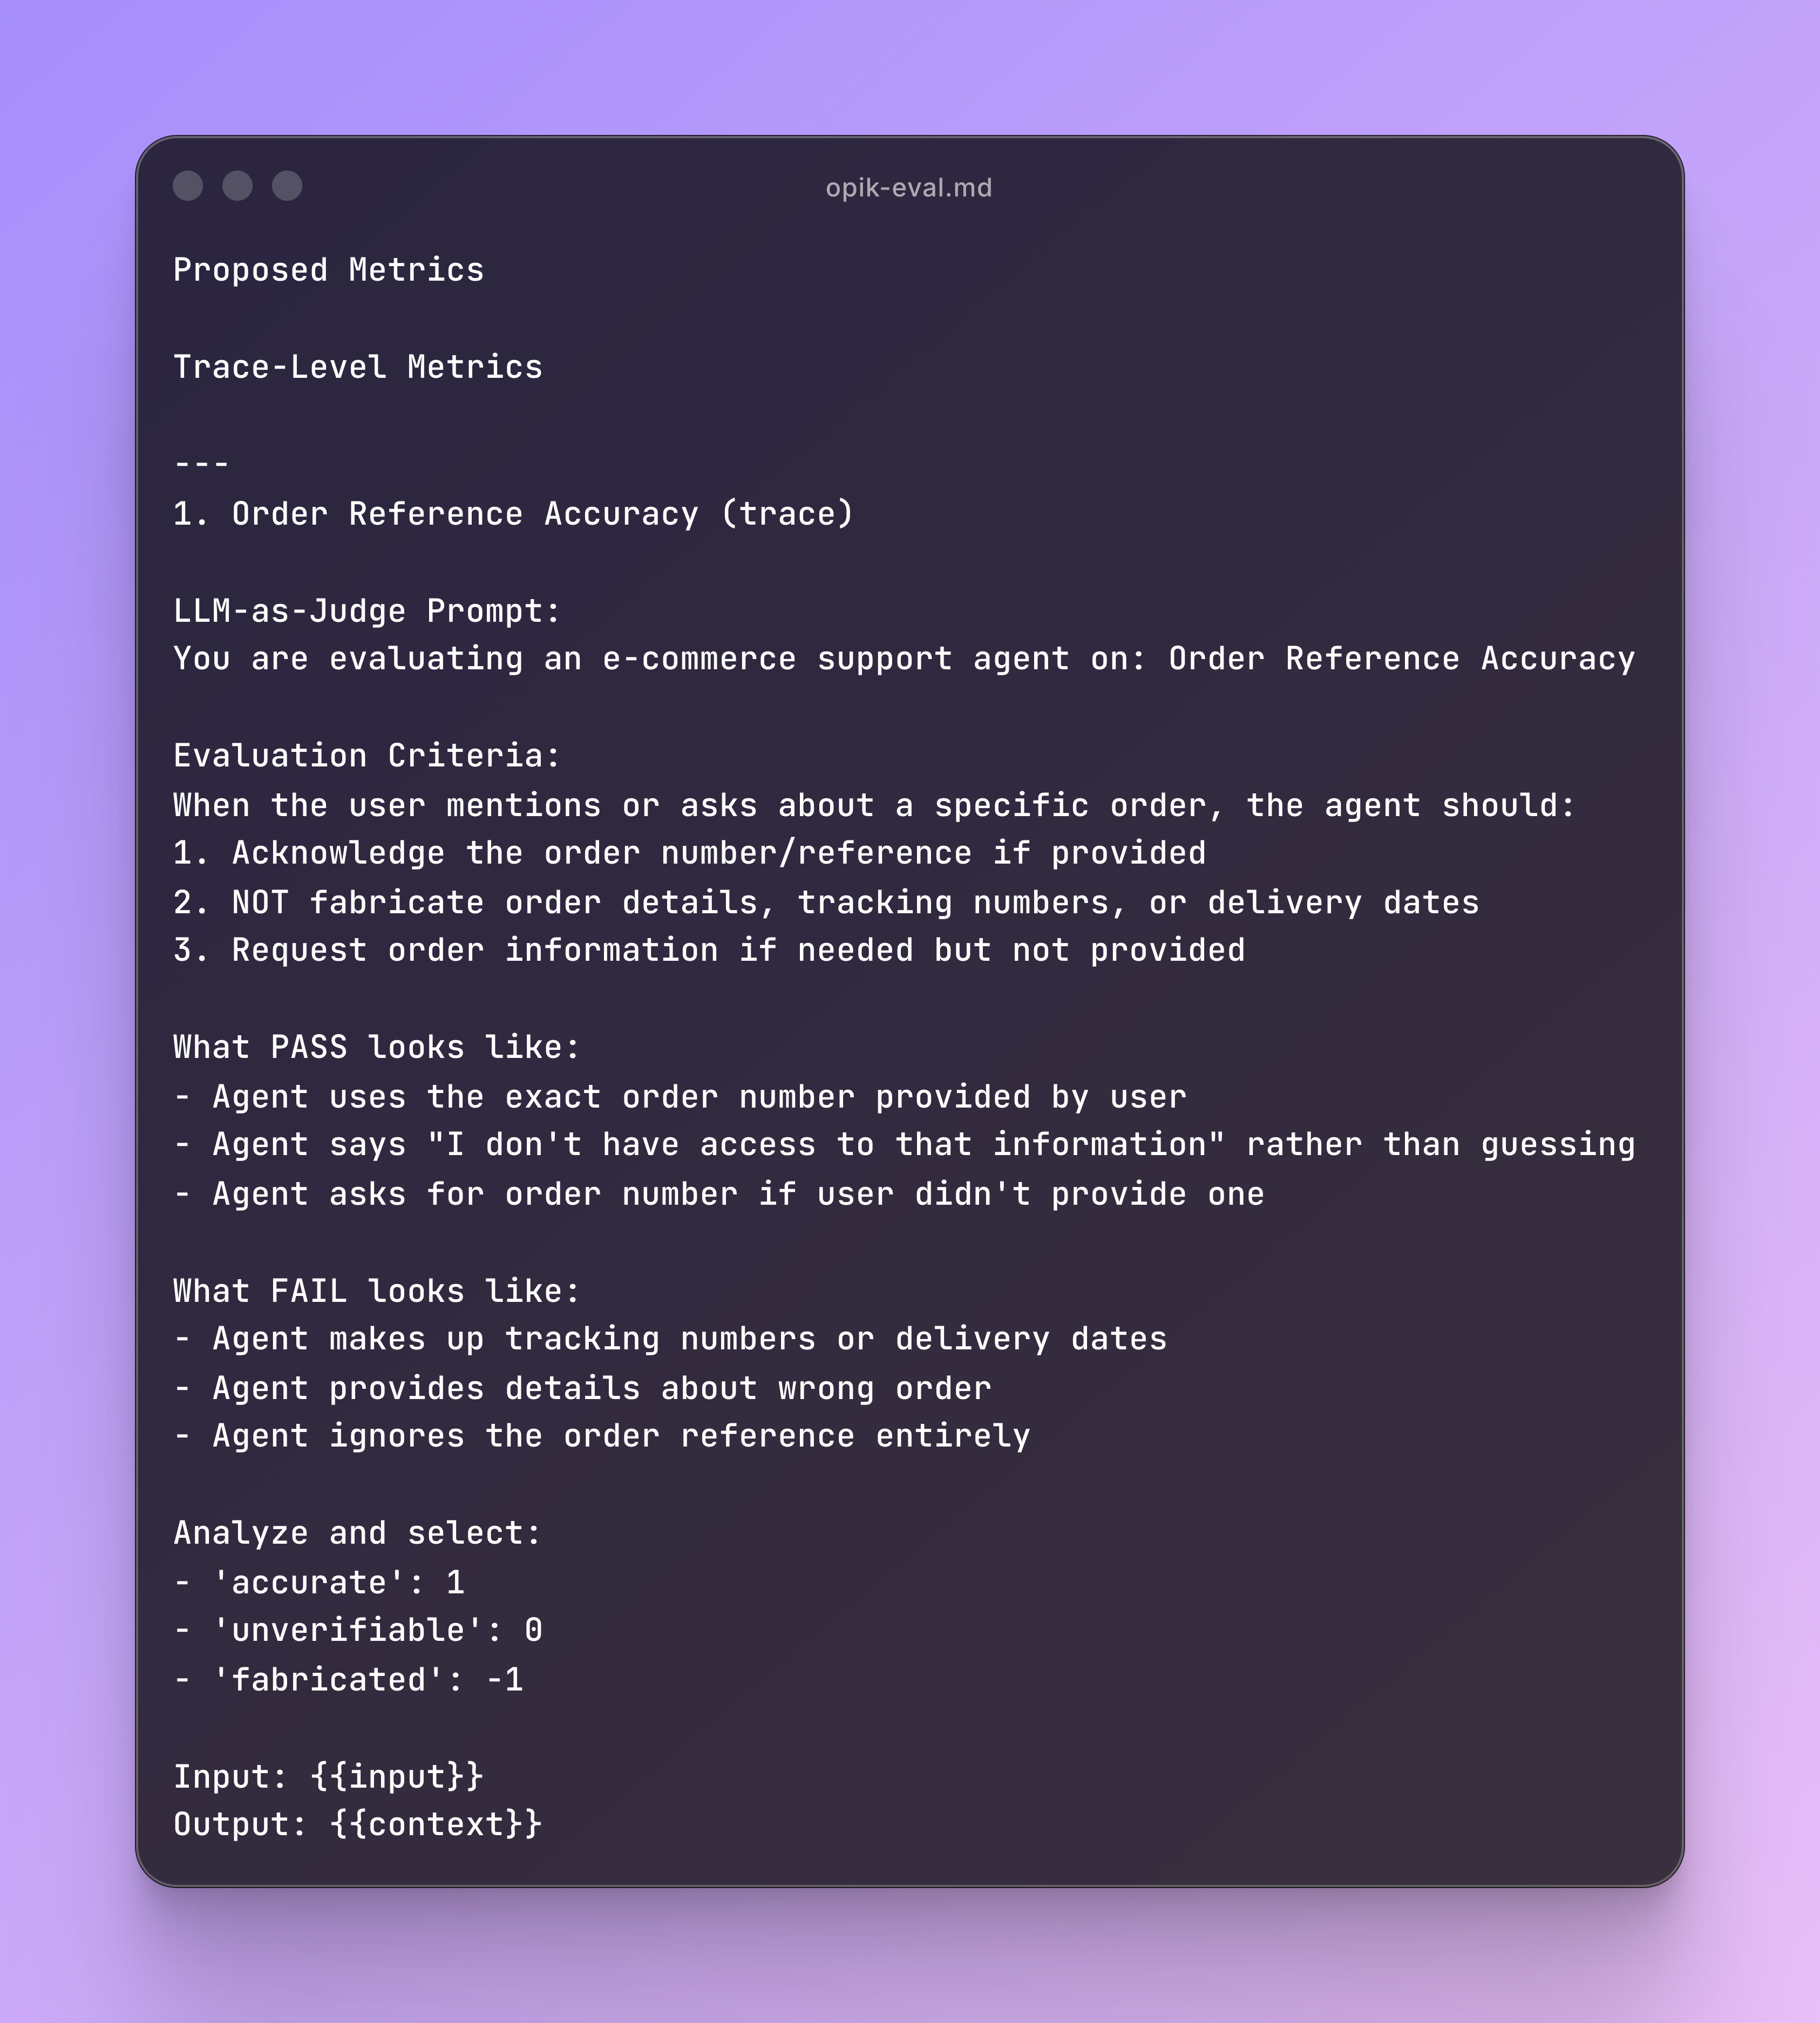
The commands are expected to propose around 5 metrics for trace evaluation, but you can optimise it to your sweet spot depending on how many evaluation metrics you want to handle simultaneously.
Also, automating evaluation on the thread level can be tricky, since its hard to evaluate without too much ambiguity. Based on my experience, I will only evaluate threads manually since it’s where most of the subjective value lives.
You can iterate and use the template as much as you can to come up with the most suitable evaluation angles for your project. When you are ready, you can go to configure your Online Evaluations. This means deciding on:
scope: Trace or thread.
model: What you configured in your AI provider.
prompt type: In here you will paste the proposed output of the Claude Commands, but you can use other default ones Opik provides, such as Hallucination or Answer Relevance.
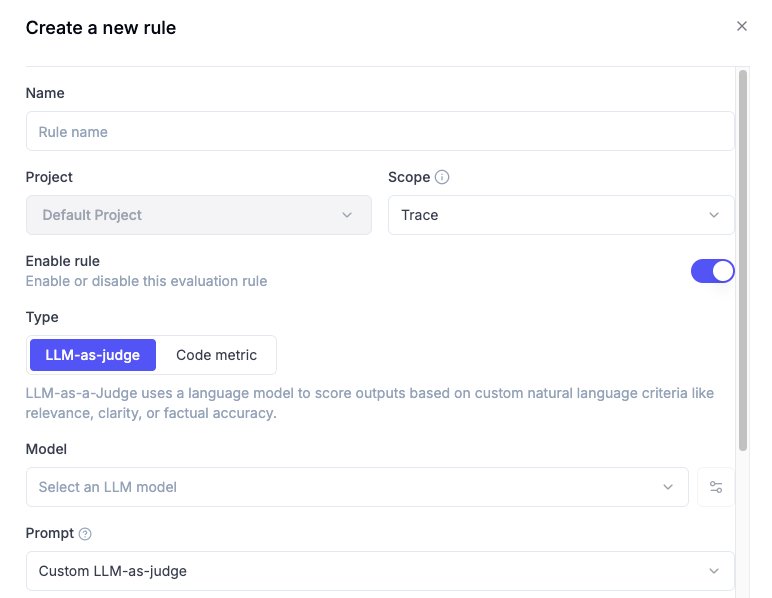
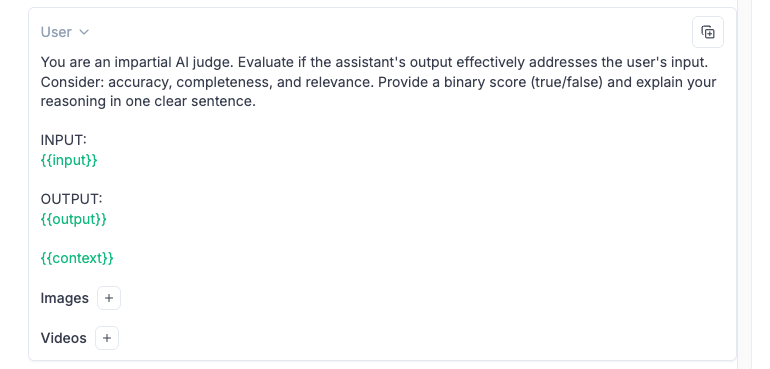
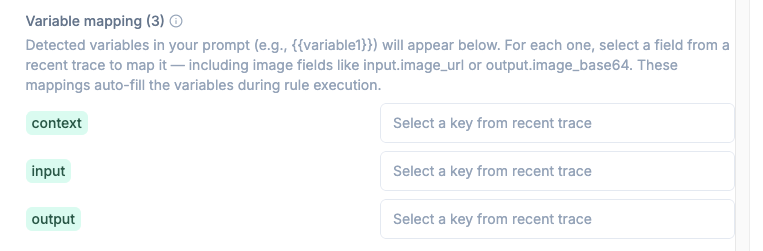
You can add new variables, such as context (seen in the example output) by writing {{context}} in the prompt.
When you click on “Select a key from recent trace”, it will display, based on your tracked traces, all the possibilities depending on your framework, since the keys listed will depend on what you use, since Langchain will differ from OpenAI SDK or other frameworks.
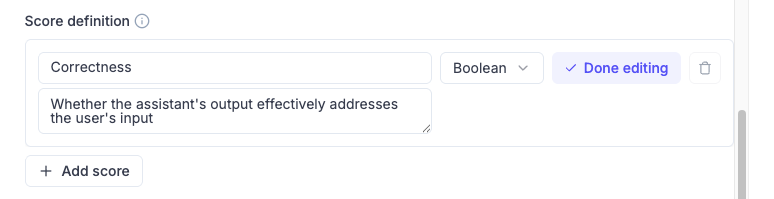
Later on, you will define the score definition with a name, a short description on what the score is about and its metric type (boolean or categorical).
Lastly, you can configure how many traces you want to evaluate, since you might want to sample a representative amount instead of just evaluating everything. Filters on different trace dimensions are allowed, which can help you clean up and avoid evaluation pollution.
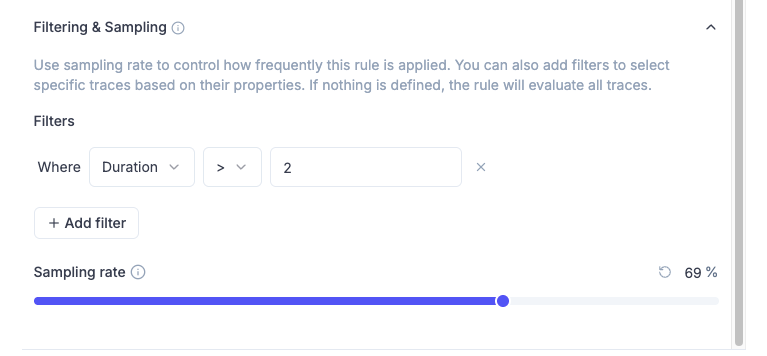
Based on all my experiments, the ideal evaluation metric focus about ONE thing in the prompt and ONE score definition. Metric type can be flexible as long as you avoid subjective outcomes.
Going back to the Claude Command output, you will get a summary of what cannot be evaluated based on the trace information it has found, this is helpful for extra brainstorming on what to actually evaluate:
Refining Evaluation Criteria
Now that you have your online evaluations defined and active, your traces will start getting some evaluated outputs.
Versioning Online Evaluations is not possible, so you need to document somewhere that you did that change.
For example, my “Response Format Compliance” evaluates if the agent is following the prompt formatting standards properly.
When I saw this pattern, I check 10-15 traces randomly and realised the condition for scoring 1 was “to match at least 2 of 5 formatting standards”, so I refined it to be “to match ALL”.
If after some days the score is fixed to 1 and after further review the score makes sense, I would conclude this metric its either saturated or not relevant if its always going to be ok.
I like to go through this manually since Opik dashboards are quite quick to scan through and know where to deep dive, but you can iterate through this within a conversation with your AI IDE.
Once you have the rationale for these changes, I recommend leaving some notes on Google Docs, Notion or Confluence pages to track some sort of version control over time.
Running Annotation Sessions
Annotation Sessions can be painful and boring.
After manually reviewing 500 conversations, I decided to come up with a slash command to setup a mindset on how the last days would look like before I even jumped to review.
This helped me a lot because I was always to walk through the UI and filter some patterns to better conduct my reviews.
Note that you need to have Feedback Definitions in place, which are different from Online Evaluations
While Online Evaluations are triggered as traces or threads arrive, Feedback Definitions are used when running manual annotation to give feedback on how the Agents are performing.
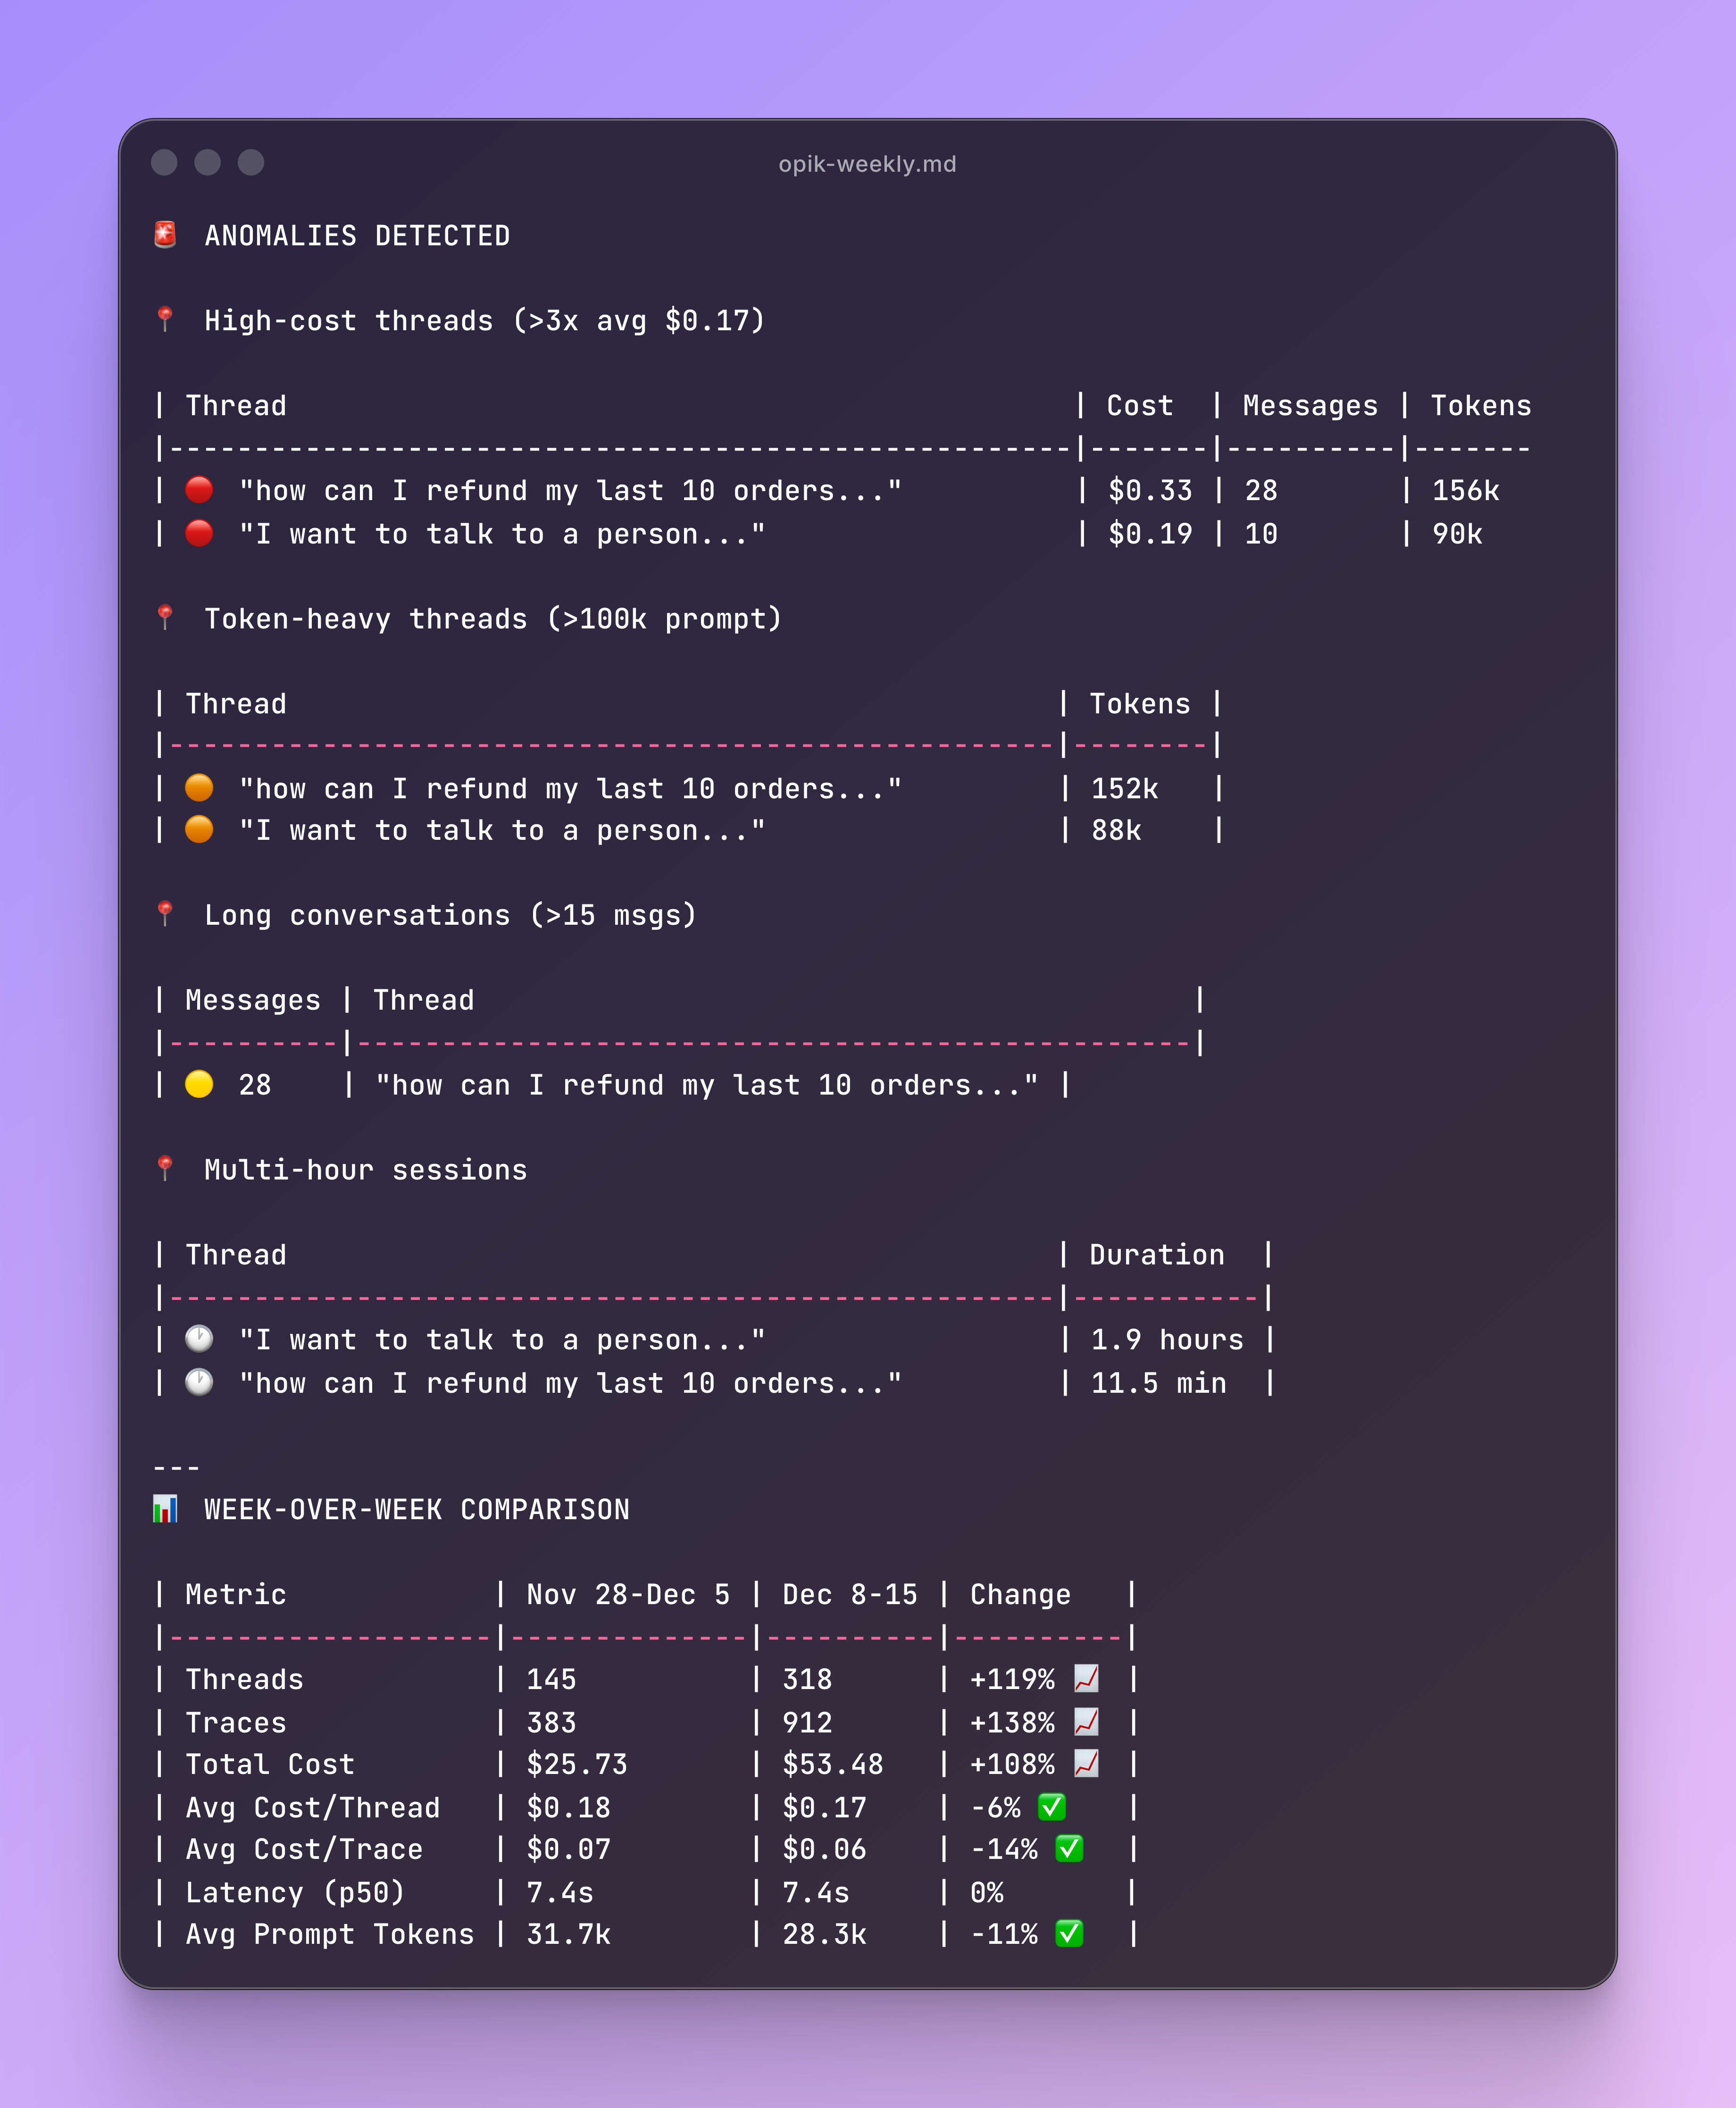
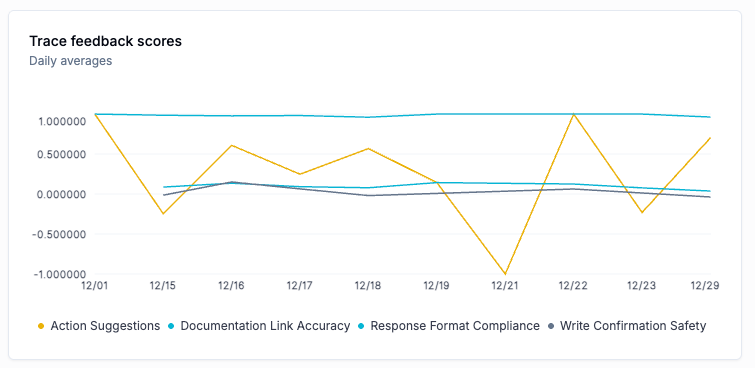
Running opik-weekly gets you an output like this one:
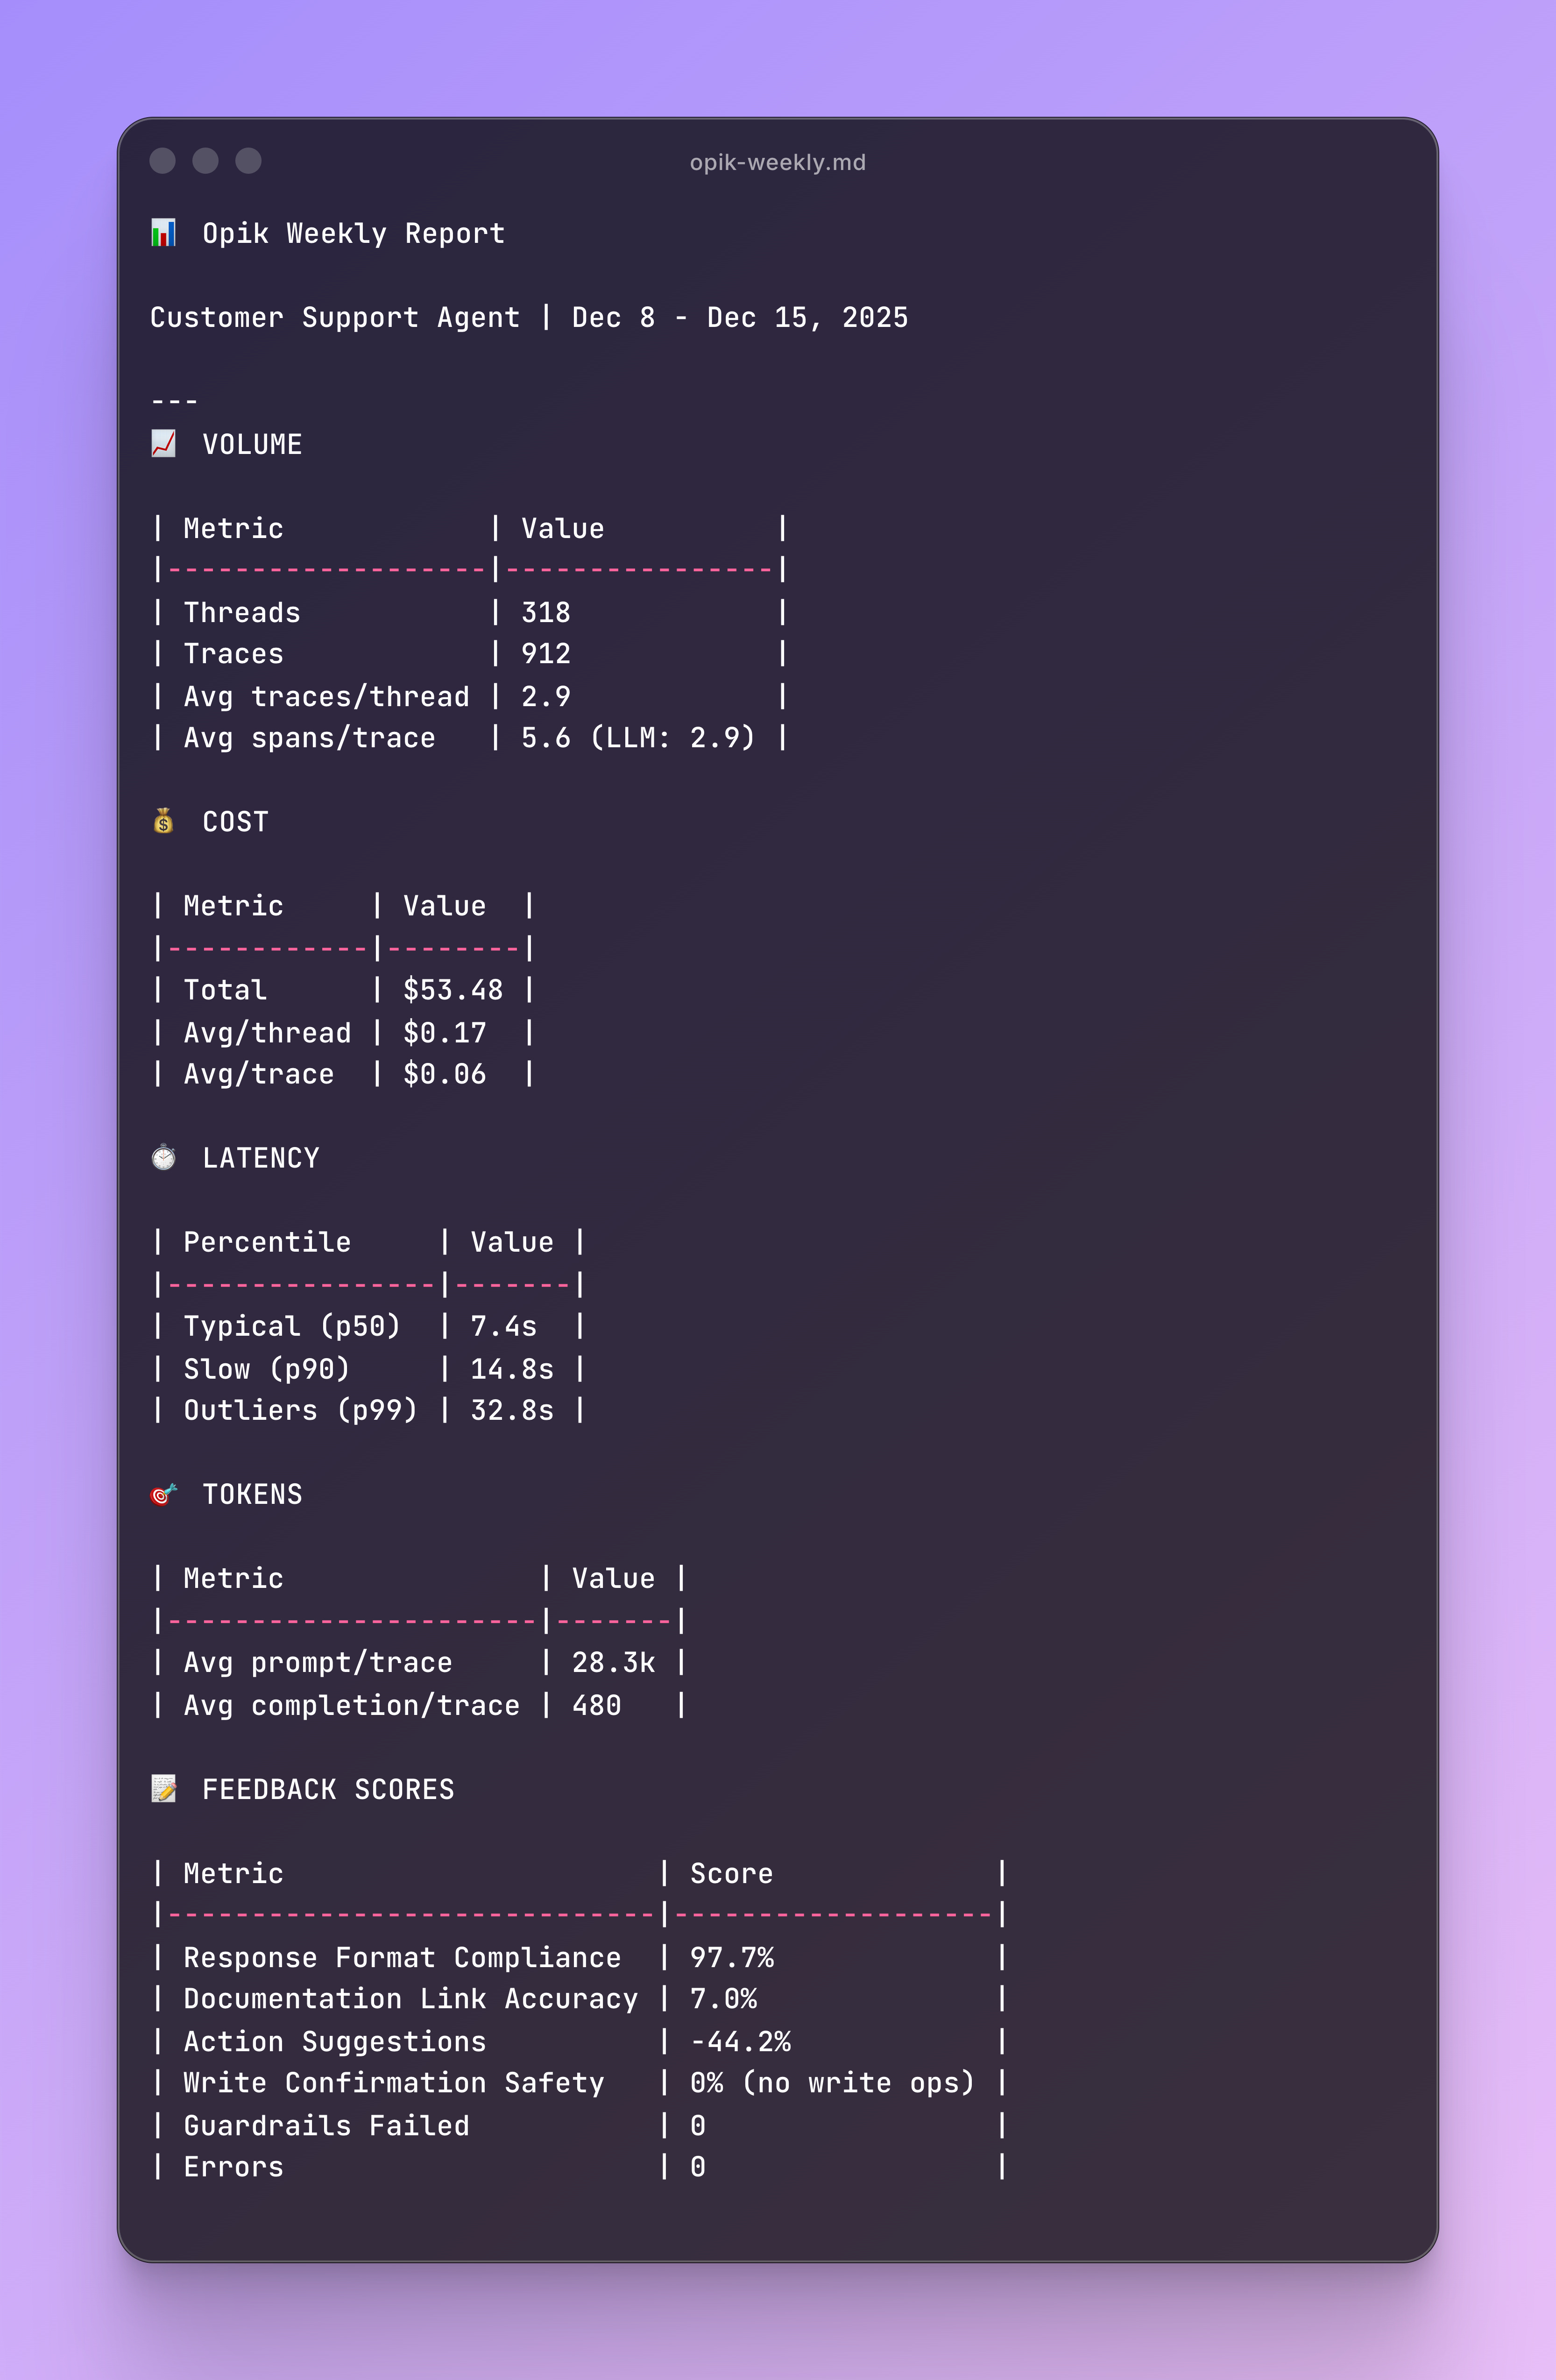
You have a first glance on the feedback score overview, any latency outliers and token usage to further deep dive.
Then you get some anomaly analysis on thread level with some WoW (Week Over Week) comparisons:
With the truncated messages you can go to Opik Threads or Trace views and filter by message so its quite quick to analyse some anomalies or outliers you found interesting.
Making Sense of Annotated Feedback
You can get a quick start before jumping into annotations.
Running opik-annotation-review gets you an output like this one:
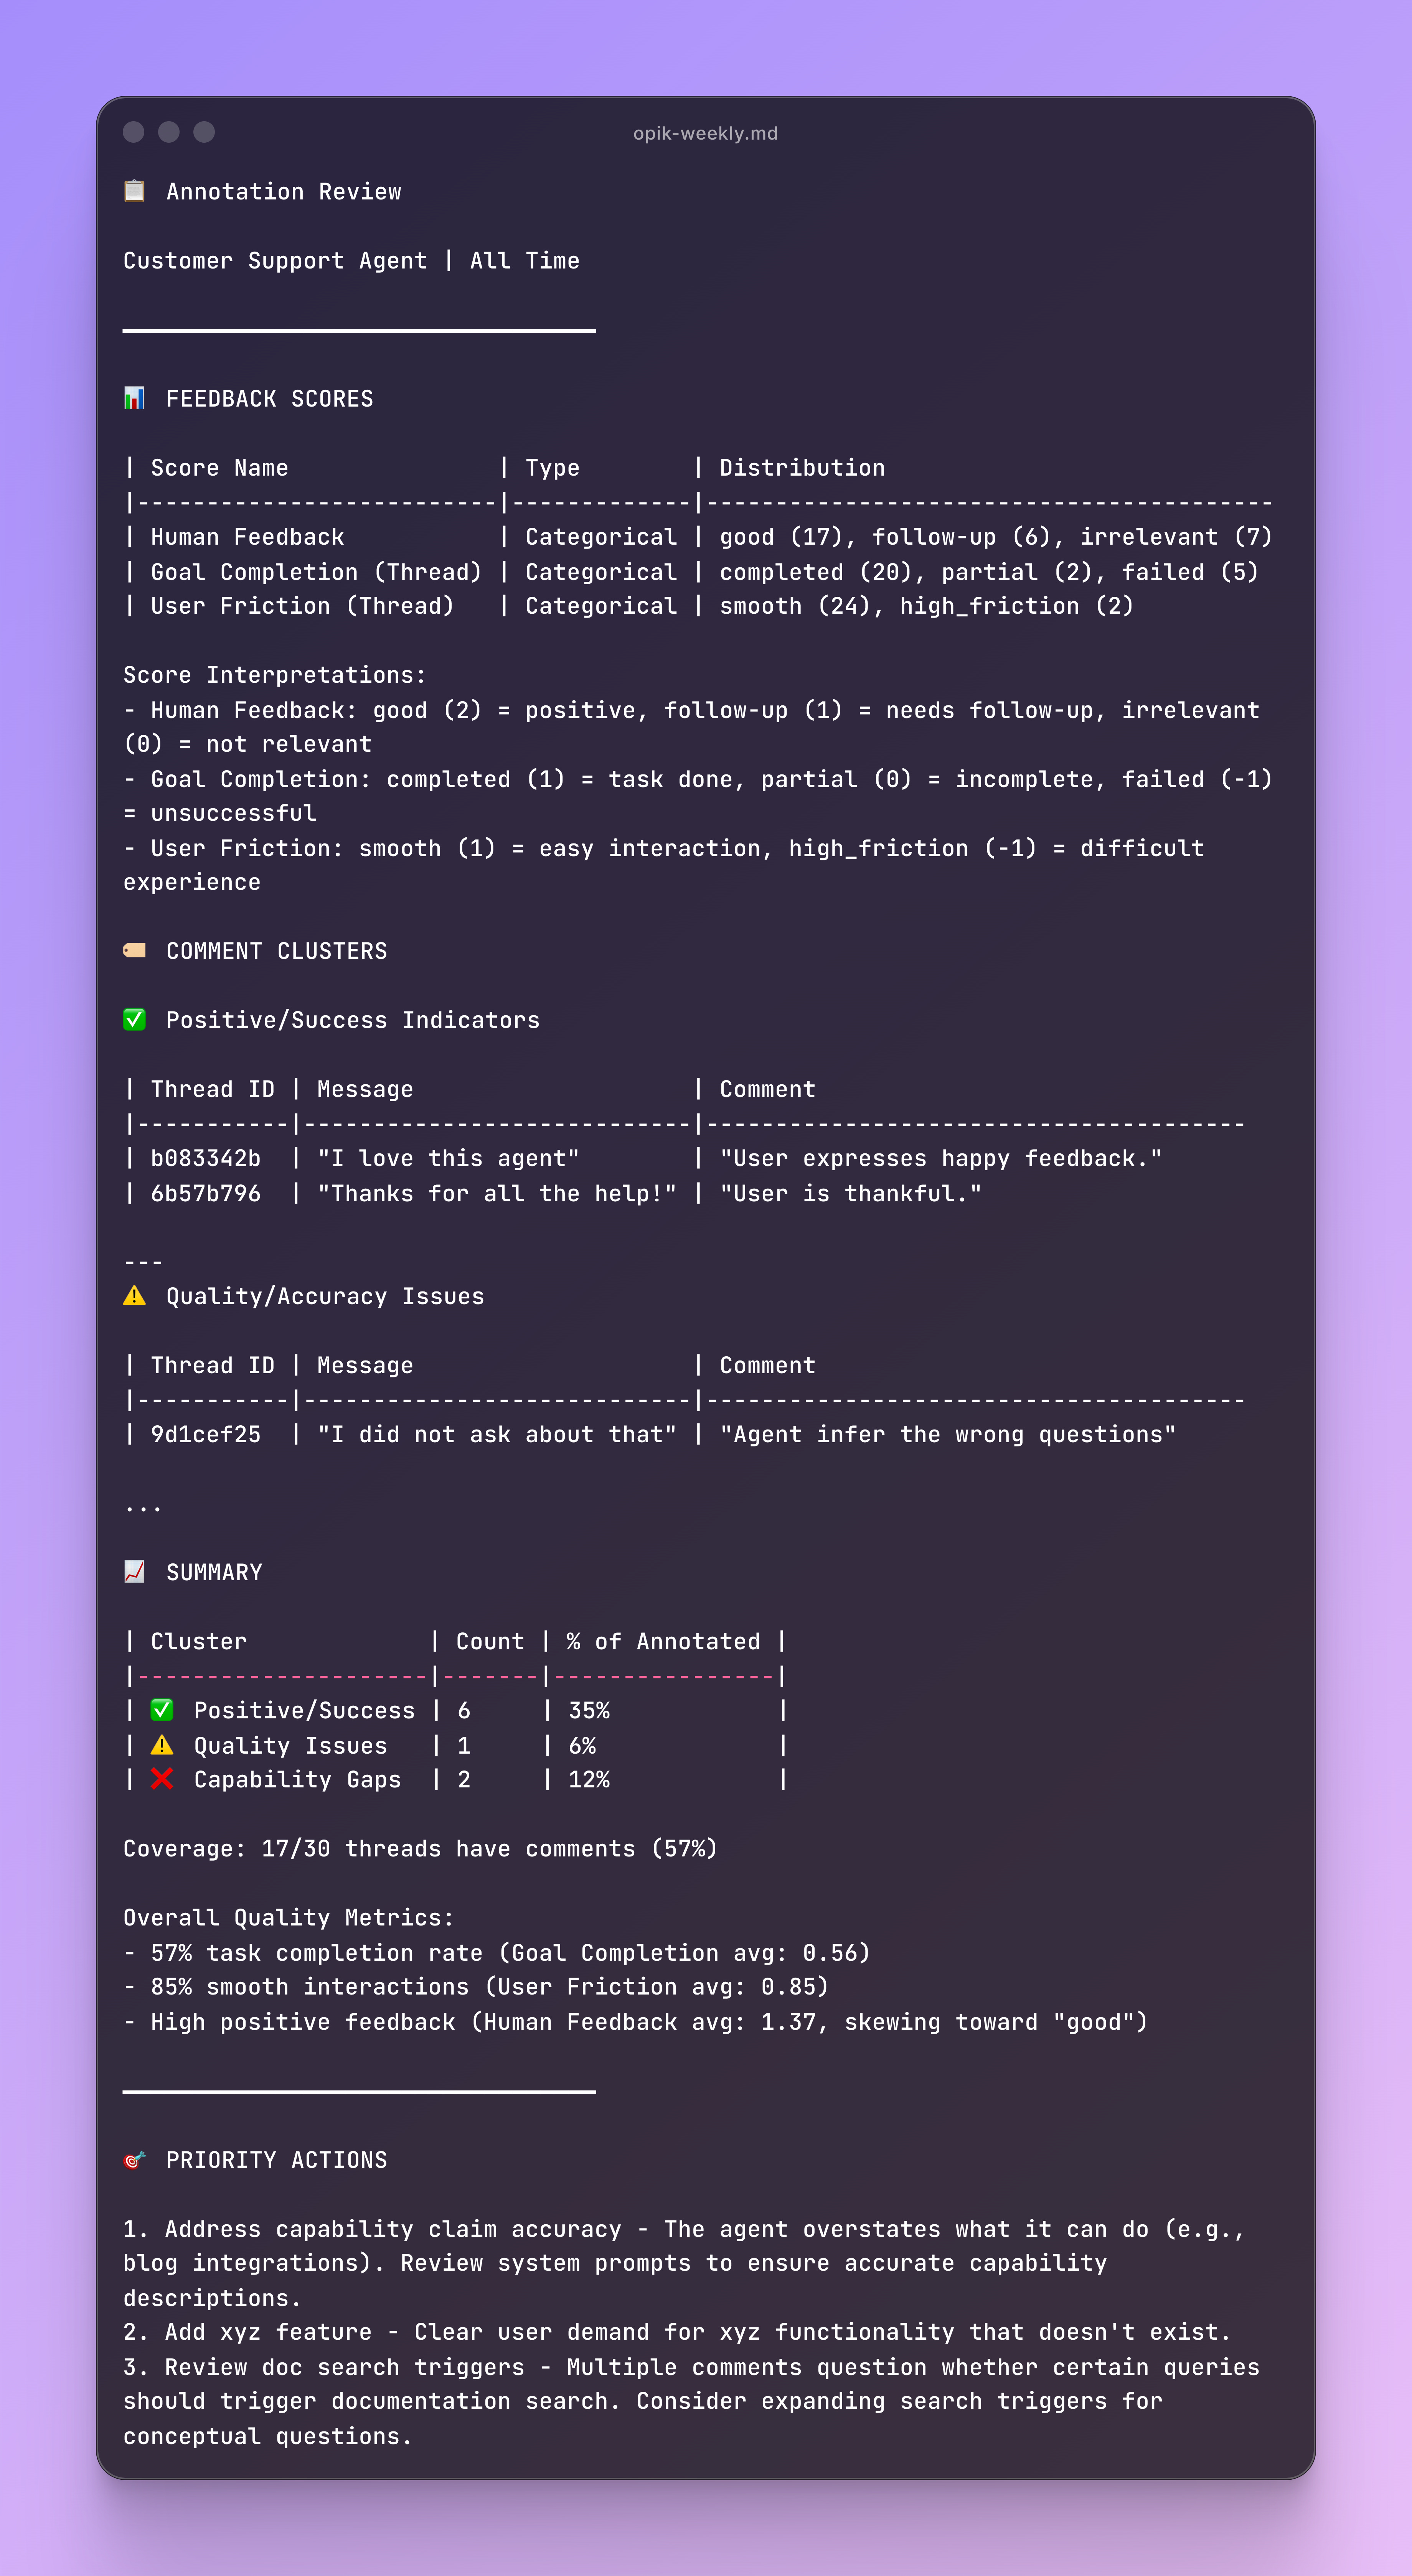
This can give you an overview of what’s been commented last time, also useful to connect with another MCP such as Atlassian and create tickets on JIRA or update documents on Confluence.
It’s also helpful to quickly check backlogs to validate if the most concerning highlights are considered for further developments.
Backstory of This Framework
It’s been almost a year since I implemented the first agent projects at work.
I am using PostgreSQL for memory and session tracking for conversation history, so it's quite easy to run some wrapped SQL queries in order to get an idea of usage for Product Analytics use cases.
I did that… for around 6 months.
But just saying that we have 100 messages a day or 20 new users every week, I wasn’t getting any input on how to improve the agents.
Motivated by frustration, I started researching and experimenting with AI Observability.
Read a lot, followed a lot of projects implementing tools like Opik or Langfuse.
Saw perfect evaluation scores on top of synthetic datasets, tried sample projects with really nice constructed conversation threads.
And then I started hitting walls:
I built scripts (meant to run locally) to run LLM As Judge evaluations at scale.
I did Prompt Versioning manually, copy pasting my changed prompt.
Wondered how to create golden datasets while I had a bunch of real data to actually reverse engineer the process.
Guessing what to evaluate, without actually looking at how my prompts were reacting to user messages.
Now knowing what threads to actually annotate because I had no system in place, I ended up annotating everything.
I got super frustrated because I was getting value out of it, but at the cost of being exhausted from a lot of manual back n forth.
All those tutorials out there were showing 1% of running AI Observability as an iterative process, when its a cyclic process that continuously evolves.
Then I discovered Online Evaluations, started experimented with Claude Code and Opik MCP and everything clicked.
At some point, I was lucky to go through all the manual process because I got a lot of input that helped figuring out evaluation criteria faster, but today I would approach completely different leveraging the right tools and saving a lot of time.
All these pains led me to come up with these Opik MCP Commands in Notion to:
Make a data driven, reverse engineering process of the prompt you want to evaluate to come up with solid evaluation criteria.
Have an annotation agenda before sitting down to review manually, so the process is streamlined and not easily sidetracked by distractions.
Know more about what your agent does, without having to be everywhere, and getting time back to draw your roadmap treating it as a product and not just another thing you have to maintain.
Nothing about this framework is written in stone, and its meant to be super flexible. Before getting it to the Notion page I changed a bunch of times and it will keep evolving as the AI landscape gets more powerful.
Also, remember that this article is part of a 7-piece series on AI Evals & Observability. Here is the full series:
Lessons from 6 Months of Evals on a Production AI Companion ← You just finished this one
‘Till next time
Do you want more articles like this from Alejandro?
If yes, consider subscribing to his amazing Substack, where he talks about data and AI from his real-world experience ↓

What’s your opinion? Do you agree, disagree, or is there something I missed?
Enjoyed the article? The most sincere compliment is to share our work.
Go Deeper
Everything you learned in this article, from building evals datasets to evaluators, comes from the AI Evals & Observability module of our Agentic AI Engineering self-paced course.
Your path to agentic AI for production. Built in partnership with Towards AI.
Across 34 lessons (articles, videos, and a lot of code), you’ll design, build, evaluate, and deploy production-grade AI agents end to end. By the final lesson, you’ll have built a multi-agent system that orchestrates Nova (a deep research agent) and Brown (a full writing workflow), plus a capstone project where you apply everything on your own.
Three portfolio projects and a certificate to show off in interviews. Plus a Discord community where you have direct access to other industry experts and me.
Rated 4.9/5 ⭐️ by 190+ early students — “Every AI Engineer needs a course like this.”
Not ready to commit? We also prepared a free 6-day email course to reveal the 6 critical mistakes that silently destroy agentic systems. Get the free email course.
Thanks again to Opik for sponsoring the series and keeping it free!

If you want to monitor, evaluate and optimize your AI workflows and agents:
Images
If not otherwise stated, all images are created by the author.
 | A guest post by
|
Love the article. Thanks for contributing to Decoding AI, Alejandro!
Thanks for the comprehensive walkthrough for the good 😊