

Your Agent's Reasoning Is Fine - Its Memory Isn't
Using GraphRAG to build a Production Engineer agent that knows dependencies, incidents, and ownership.

The pager goes off at 02:13.
One service is down. Then another 10 follow. Restarts begin. Logs and dashboards come up side by side.
The graph looks familiar. The error rate spikes, rolls back, spikes again. Someone pastes a dashboard link into Slack. Someone else replies with a half-sentence: “Didn’t we see this two weeks ago?” No ticket is linked. No postmortem is found. The incident feels known, but undocumented.
A workaround exists. Everyone knows that much. Nobody knows why.
It lives in a shell script, wrapped in a cron job, guarded by a comment that says “DO NOT REMOVE”. The person who wrote it left two companies ago. The context left with them.
Slack then becomes an archaeological dig. You scroll past emojis, past renamed channels, past a debate that ends mid-thread. Somewhere in 2021, an engineer explains the underlying problem, but no action is taken for now.
This is how enterprise systems decay. Not through broken code, but through forgotten understanding.
And this is how production engineers start carrying all this history in their heads.
They know which alert is real. Which one needs a manual nudge. Where each dependency lies. Which rollback will make things worse. Over time, the entire system is held together not by documentation or dashboards, but by the accumulated memory of our production engineers.
This works until it doesn’t. When the wrong person is asleep. When someone leaves. When the system grows just large enough that no single mind can hold it all anymore.
In this article, I want to walk through a very concrete use case and design it together with you.
We will design a Production Engineer agent that reacts to alerts by identifying the affected services and teams, understanding how the issue propagates through the system, and surfacing the context that engineers need to act quickly.

By the end, you will have a clear understanding of how to design an agent for monitoring and reasoning about production systems, and more importantly, how to design the right kind of memory to support it.
The twist is that the agent’s real superpower isn’t reasoning—it’s GraphRAG.
Let’s unpack why.
But first, a quick word from our sponsor, Opik ↓
AI Agents Virtual Hackathon With $30,000 in Prizes (Sponsored)
Want to get motivated to build that AI agent you had in mind in the past 12 months while having fun, meeting cool people and potentially earning up to $10,000 (in cash per team)?
Hackathons are the best way to do that.
Opik is hosting a free one, together with Google DeepMind and Vercel, offering $30,000 in prizes with a single goal: building and shipping AI agents.
But wait. That sounds like a scam. Not really. The catch is that you have to put in the work during the hackathon to convince the judge that your AI app is worth the prize.
The worst that can happen? You have the chance, for free, to access:
Expert Workshops: Learn observability, evaluation, and agent optimization from Comet’s team
Premium Tools: Credits and support from Google, Vercel, and other partners
Direct Mentorship: Technical support throughout the hackathon via Discord
Prizes will be awarded based on the 6 challenges below. You can win one category plus the best use of Opik, totaling $10,000.

My take? The money is just a bonus, as this is a fantastic opportunity to learn for free from industry experts while building:
LLM judges to evaluate your custom business use case.
Agentic RAG applications or coding agents.
Automated prompt tuning loops and guardrails.
Or whatever AI agent moves and motivates you!
Who Should Join?
Developers with:
Basic understanding of LLMs and AI agents
Experience building software applications
Python or TypeScript knowledge
Sounds like this is for you? Then register here:
Be quick! You can register at any time during the event, up to the project submission on February 9.
↓ Now, let’s move back to our article.
1. Our use case: The Production Engineer
As companies grow, their systems rarely fail in isolation. Services depend on other services, teams depend on teams, and ownership is spread across layers that are hard to see from any single place.
When something breaks upstream, the downstream impact is often unclear. Engineers are left stitching together context from dashboards, Slack threads, old announcements, and workarounds buried in Confluence.
The problem is clear. Most issues are fixable. What slows teams down is figuring out what is really happening and how far it reaches before time is lost.
This is where the Production Engineer agent comes in.
The feature we want to design is simple, but powerful. When an alert is triggered, the agent should be able to:
understand how the failure propagates across the organization, including which services are affected and which teams are responsible
diagnose likely causes using known dependencies and patterns from past incidents
surface the relevant context that engineers usually spend hours reconstructing from dashboards, Slack threads, and internal documentation
Why is this important?
Because most production incidents are not slowed down by the lack of a fix. They are slowed down by the lack of clarity. Engineers need to understand what is happening, how far the issue reaches, and who needs to be involved before they can act with confidence.
The goal is to shorten the time between detection and action, especially in large enterprises where context is fragmented, and knowledge is spread all over.
To build something like this reliably, we need to carefully design the system and how information flows through it. That starts with the architecture.
2. Designing the architecture
Now, let's break down exactly how this system would work when that 02:13 pager goes off.
At that point, the goal is not just to raise an alert, but to immediately attach the right context so engineers don’t have to reconstruct it manually. The architecture is designed to do exactly that.
The interface of our Production Engineer Agent is intentionally straightforward:
Input comes from monitoring systems via webhook API: Prometheus sends POST requests to our FastAPI endpoint, each payload including service name, error type, severity, and timestamp. The webhook fires the moment something crosses a threshold.
Output goes to all affected teams via Slack: Structured incident reports are posted to relevant team channels, tagged with the right on-call engineers and linked to runbooks, past incidents, and related documentation.
The diagram below shows how GraphRAG and MCP wire this together:
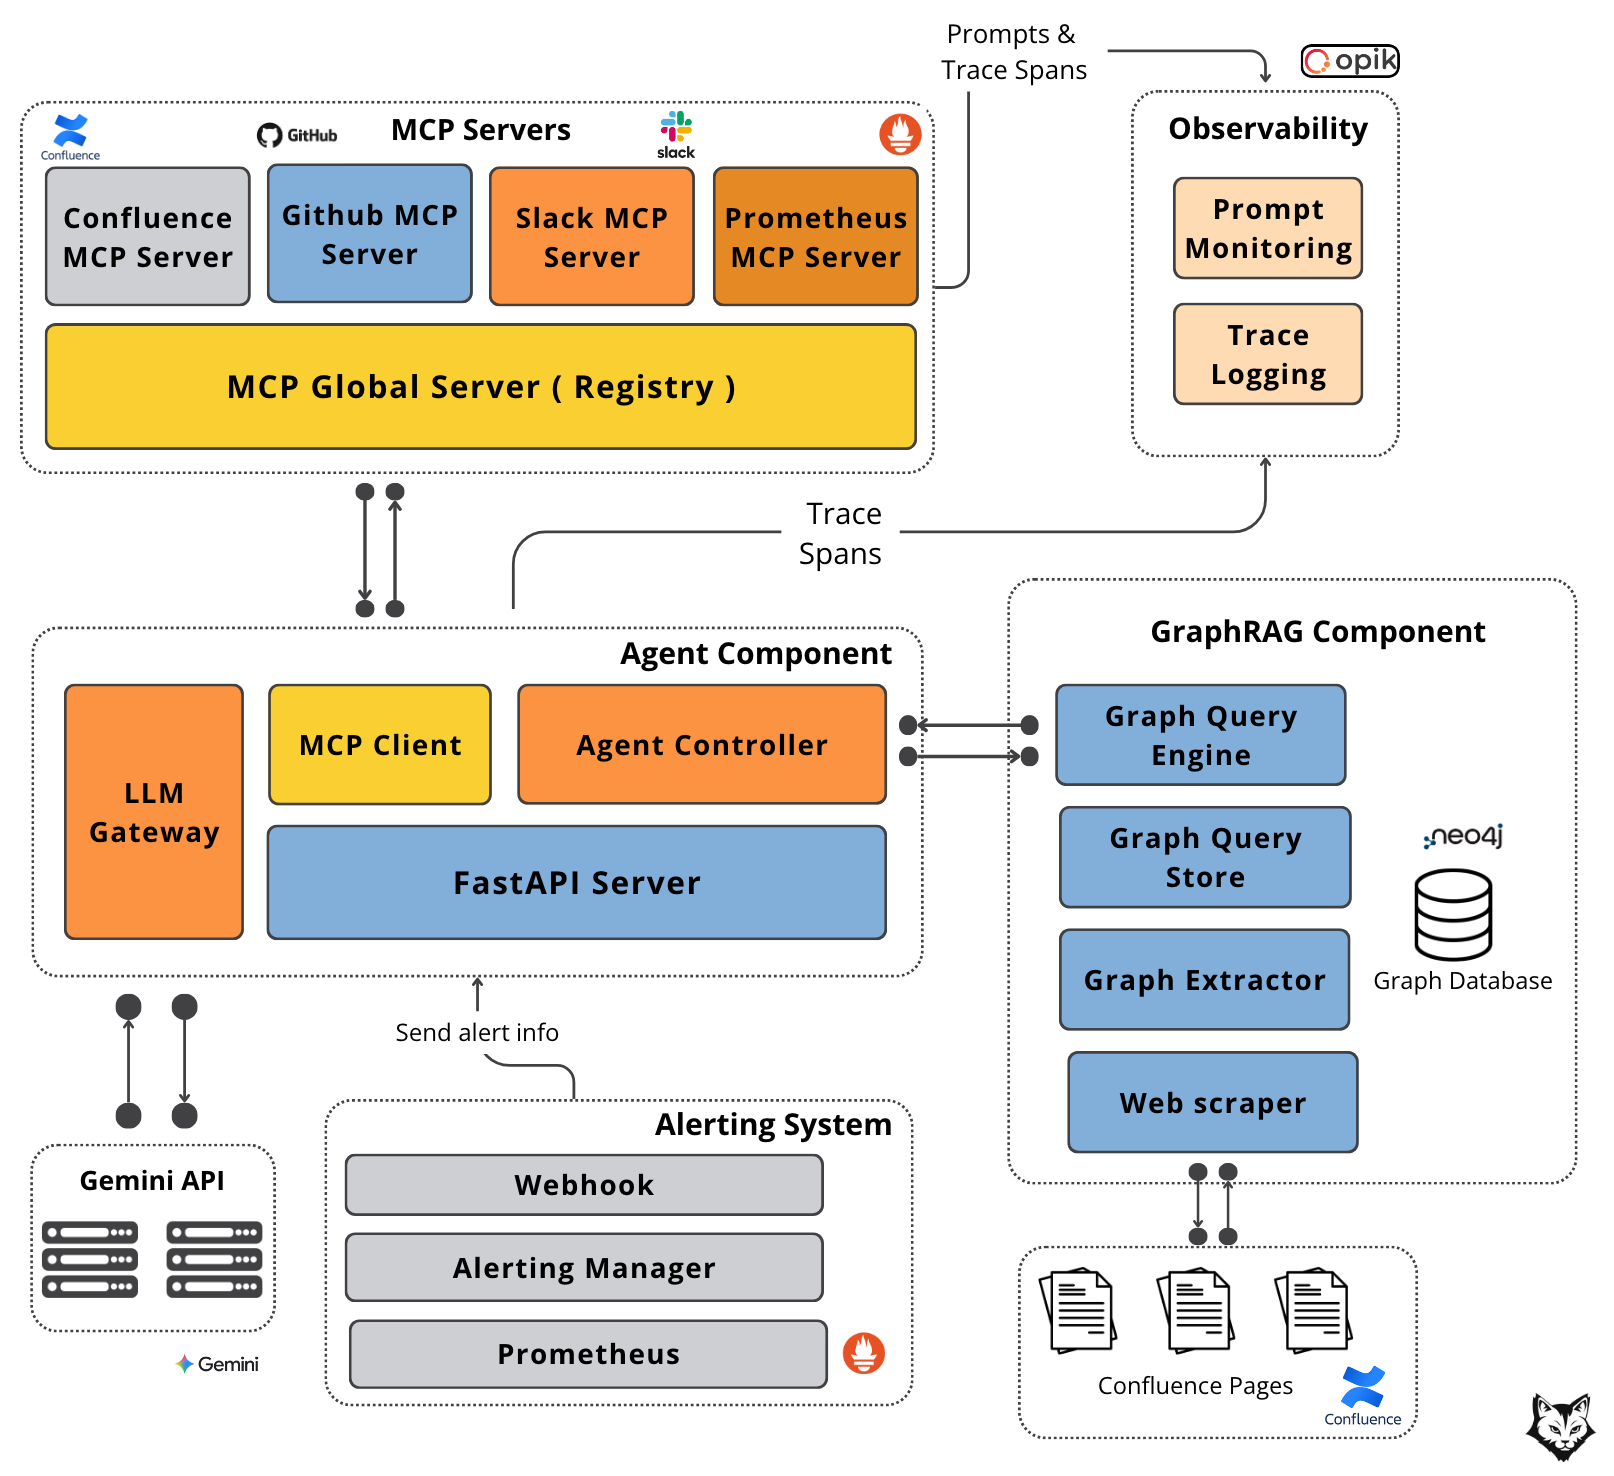
At a high level, the system is decomposed into five components, each with a clearly defined responsibility and a well-scoped interface:
#1. Alerting System
This is a standard component in any enterprise environment. Prometheus detects threshold breaches and emits alerts, which are routed through Alertmanager. From there, alerts are delivered via webhook to our FastAPI server. This webhook is the entry point for every incident and the only way external signals enter the agent system.
#2. Agent Component
The Agent Component orchestrates the entire flow. The FastAPI server receives the alert payload and forwards it to the Agent Controller, which is responsible for handling the agent loop:
invoking tools via the MCP Client (used to communicate with external systems),
querying the GraphRAG component to retrieve contextual knowledge about teams, system dependencies, and ownership.
preparing the prompt and additional context, sending it to the LLM through the LLM Gateway, which handles all direct interaction with the Gemini API.
It serves as the coordination layer between context retrieval, tool execution, and model inference.
#3. GraphRAG Component
GraphRAG serves as the agent’s long-term, structured memory. It is built on a Neo4j graph database that models services, teams, and other dependencies as a property graph, with vector embeddings attached to nodes.
The Graph Query Engine performs graph traversals to retrieve the most relevant entities and their dependencies based on the incident context. The graph itself is populated offline by a Graph Extractor, which ingests organizational data from sources such as Confluence documentation.
#4. MCP Servers
MCP servers provide real-time, external context. A global MCP router forwards requests to specialized servers:
Confluence MCP retrieves documentation,
GitHub MCP fetches recent code changes and release information,
Slack MCP searches historical discussions and posts updates to support channels,
Prometheus MCP retrieves live metrics.
This separation allows each data source to evolve independently while presenting a uniform interface to the agent.
#5. Observability
Observability is handled through Opik. Prompt Monitoring tracks the agent’s questions, tool usage, and retrieval strategies, while Trace Logging records executed queries and their latency.
Together, these signals provide visibility into how the agent reasons, what it accesses, and where time is spent.
Now that we understand each component, let’s walk through the data flow:
Prometheus detects a threshold breach and fires a webhook to the Alerting Manager with service name, error type, severity, and timestamp.
The Alerting Manager routes the alert to our FastAPI Server endpoint, which hands it to the Agent Controller.
The Agent Controller queries the GraphRAG Component for related context. The Graph Query Engine does a semantic search to retrieve the nodes closest (“communities”) to the query and fetches them along with their dependencies.
With graph context assembled, the Agent Controller sends a plan to Gemini specifying which MCP servers to call for real-time data.
Gemini returns the required tools. The Agent Controller invokes the Global MCP Server with the list.
Each requested MCP server is called: GitHub for fetching recent code changes/releases, Slack searches incident discussions, Confluence retrieves documentation, and Prometheus pulls current metrics.
The Agent Controller sends all context to Gemini and fresh MCP data.
Gemini synthesizes everything into a structured incident report with impact summary, pattern recognition, recent changes, current state, and recommended actions.
The report goes to the Slack MCP Server, which posts it to affected team channels.
Note: Gemini may request additional MCP tool calls as needed, meaning steps 6-11 can loop until the complete context is gathered.
And just like that, the incident is contextualized and actionable in seconds, before the engineer opens their laptop.
But this speed does not come from the agent loop alone.
What makes this possible is the memory behind it, the way organizational knowledge is stored, connected, and retrieved at the moment it is needed.
This is where GraphRAG enters the picture.
3. Graph RAG as our organization's knowledge
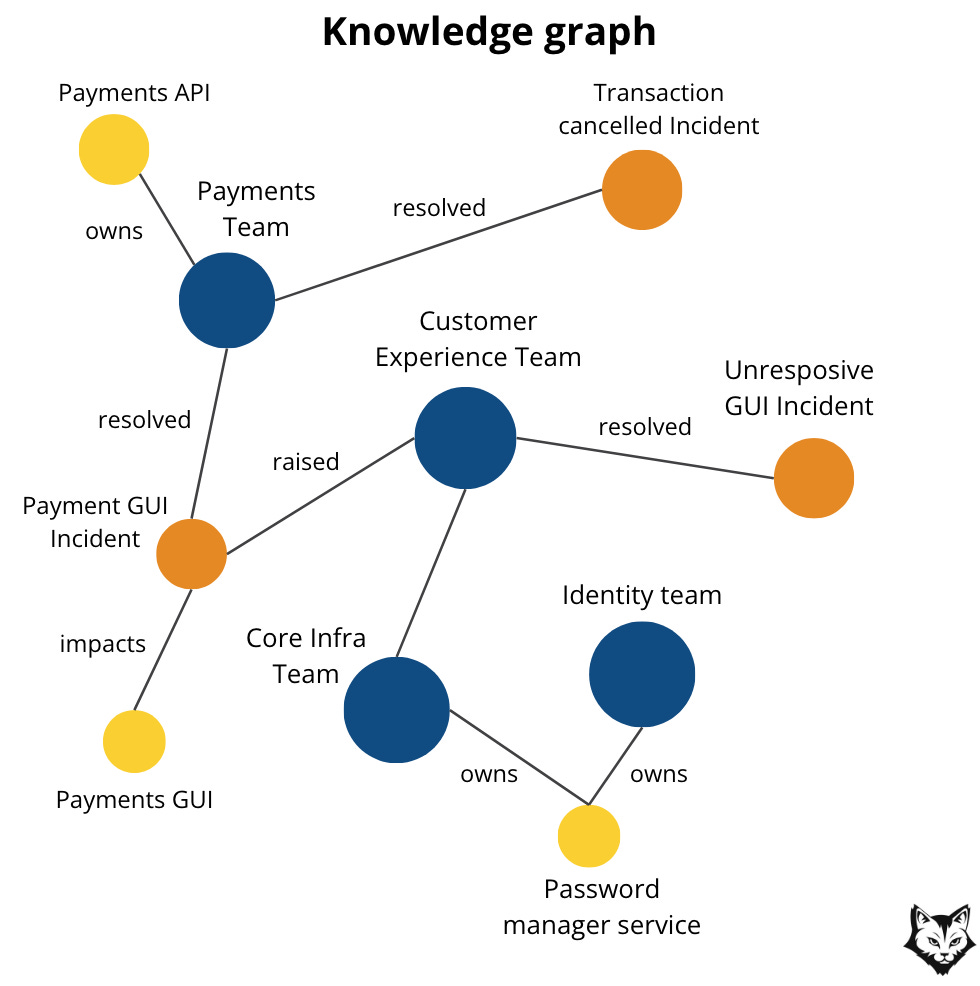
Before we talk about GraphRAG, we need to clarify the foundation it builds upon: the knowledge graph.
What Is a Knowledge Graph?
A knowledge graph is a structured way of representing information as a system of connected components:
Nodes represent entities such as documents, services, concepts, teams, incidents, or decisions
Edges represent relationships between those entities
Properties on nodes and edges store metadata like summaries, timestamps, ownership, or importance
Unlike flat document stores or pure vector databases, a knowledge graph explicitly captures how information is connected, not just where it appears.
From a production perspective, this matters because it enables things we rely on every day:
Tracing relationships (“what depends on this service?”)
Aggregating information across multiple sources
Preserving institutional knowledge beyond individual files, tickets, or dashboards
In practice, a knowledge graph becomes a shared semantic layer for the organization: a living map of how systems, documentation, decisions, and operational knowledge relate to one another.
What Is GraphRAG?
GraphRAG is Retrieval-Augmented Generation (RAG) using a Knowledge Graph.
At a high level, the difference is simple:
Traditional RAG retrieves the most semantically similar text chunks from a vector database.
GraphRAG retrieves connected knowledge by traversing relationships in a graph.
For us, the most useful way to think about GraphRAG is this:
GraphRAG is a set of RAG patterns where retrieval is guided by graph structure, not just similarity scores.
Each pattern depends on having the right graph representation in place.
Why GraphRAG for Organizational Knowledge?
In production environments, we rarely ask questions that can be answered by a handful of similar text snippets.
Instead, we ask questions like:
“What do we know about this issue across teams and services?”
“Summarize everything related to this initiative and its downstream dependencies.”
These are coverage and synthesis questions, not similarity questions.
A similarity-based retriever might return a few highly relevant chunks, but still miss:
Entire systems
Related incidents
Important but differently worded documentation
GraphRAG is designed specifically for this class of problems.
The GraphRAG Approach
At a high level, GraphRAG works in two phases:
Graph Generation – turning raw organizational knowledge into a structured, navigable graph
Query Answering – using that structure to retrieve a complete and connected context, not just similar text
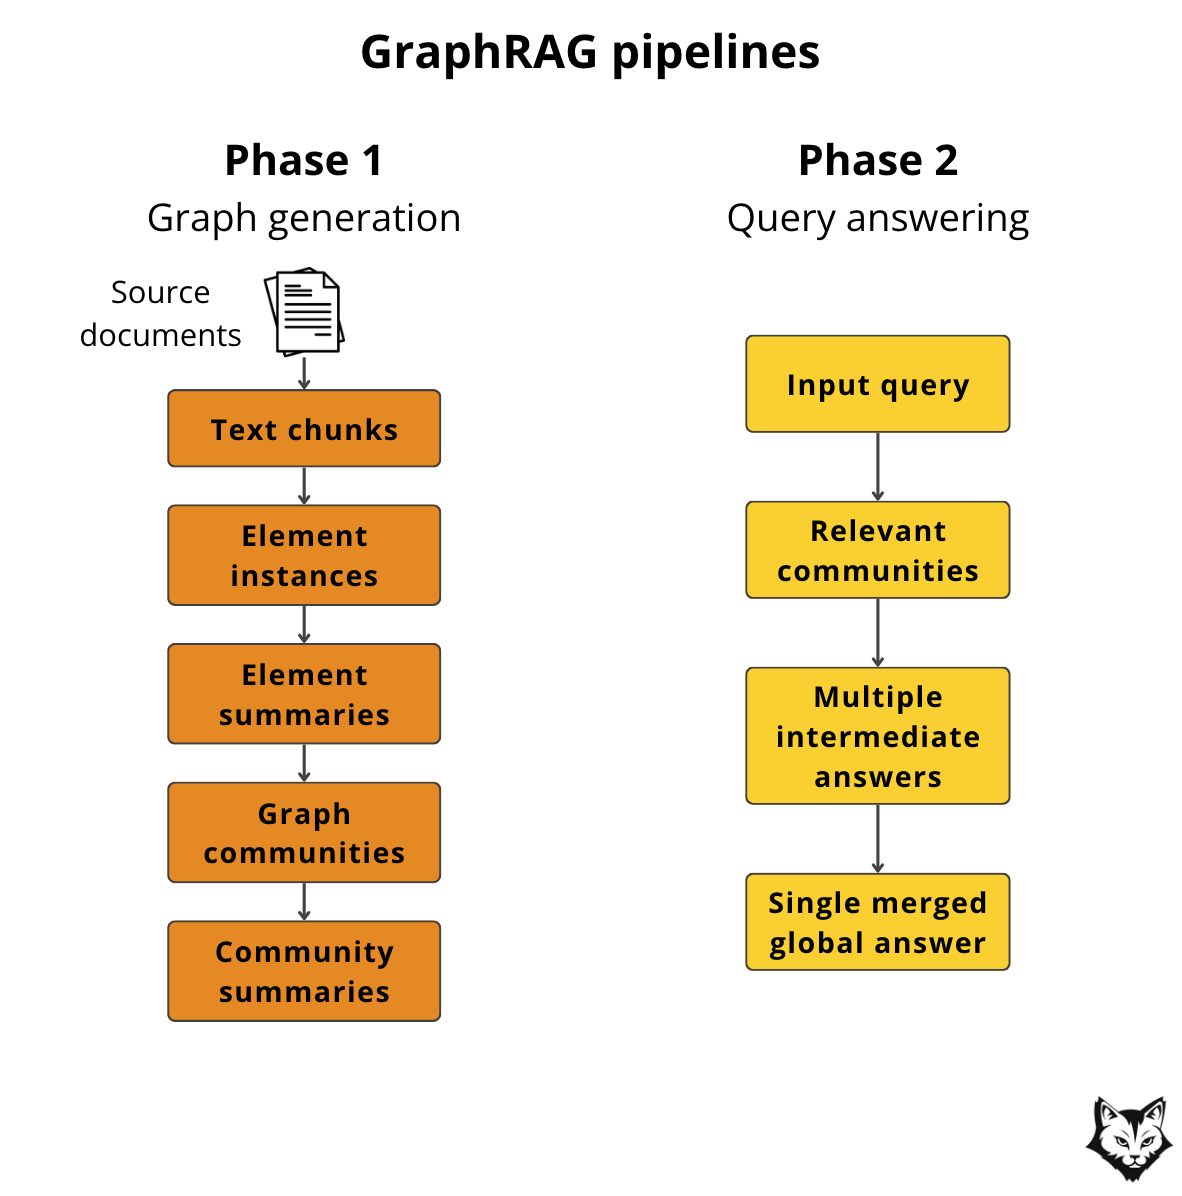
Phase 1: Graph Generation
1. Source Documents → Text Chunks
GraphRAG starts by breaking source documents into smaller text chunks. This is a practical necessity. Large documents are difficult to index, reason over, and retrieve from reliably.
In our case, these source documents include internal architecture documentation, runbooks, postmortems, and operational notes. Chunking ensures that knowledge about a single service, failure mode, or mitigation strategy can be surfaced independently.
At this stage, we still have unstructured text. The graph does not exist yet.
2. Text Chunks → Element Instances (Entities & Relationships)
Each chunk is then analyzed to extract what GraphRAG calls elements. An element is not yet a node or an edge in the graph. It is an intermediate representation that captures either:
an entity, such as a service, team, incident, or concept
or a relationship between two entities, such as “depends on,” “owned by,” or “caused by”
You can think of elements as structured facts derived from text.
For example, from a paragraph in a postmortem, the system might extract:
an entity element for
Service Aan entity element for
Service Ba relationship element expressing that
Service A depends on Service B
At this point, these are still logical units, not graph objects. They are normalized, deduplicated, and reconciled across chunks.
3. Element Instances → Element Summaries
Once elements are extracted, the LLM generates concise summaries for each one. These summaries give semantic meaning to otherwise low-level identifiers.
In practice, this means that a service or incident is no longer just a name, but a short, human-readable description that captures its role, behavior, and operational significance.
Only after this step do elements become concrete graph objects.
Entity elements become nodes.
Relationship elements become edges.
Summaries and metadata become node and edge properties.
This is the point where the knowledge graph is actually formed.
4. Element Summaries → Graph Communities
As the graph grows, individual nodes become less useful in isolation.
GraphRAG addresses this by clustering the graph into communities using graph algorithms such as hierarchical Leiden. Each community represents a tightly connected subgraph that corresponds to a coherent topic or domain.
For our organization, these communities naturally align with real operational boundaries: a platform area, a group of interdependent services, or a recurring class of incidents. This clustering emerges from the data itself rather than being manually defined, which is important in production environments where systems evolve faster than documentation.
5. Graph Communities → Community Summaries
After communities are formed, the LLM generates a summary for each one. These summaries describe what the community is about and how its elements relate to each other, effectively creating a higher-level index over the graph.
In our use case, these community summaries become the primary unit of retrieval.
Phase 2: Answering the Query
When a query is issued, our Agentic GraphRAG does the following:
identifies the relevant communities
generates intermediate answers from each
merges them into a single global response
For production engineers, this means questions like “What do we know about failures related to service X?” or “What systems are involved in this incident class?” are answered using a complete, connected view of organizational knowledge.
Now to make GraphRAG work for our use case, we need a graph that reflects how on-call engineers already think: services, dependencies, ownership, incidents, and the artifacts that explain them.
A simple schema is enough to start:
Nodes
Service (name, domain, tier, repo, tags, embedding)
Team (name, oncall channel, owners, embedding)
Incident (id, timestamp, severity, summary, embedding)
Runbook (url, title, steps summary, embedding)
Doc (source, url, title, embedding)
Release/PR (id, timestamp, author, summary, embedding)
Relationships
DEPENDS_ON(Service → Service)OWNED_BY(Service → Team)AFFECTED(Incident → Service)RESPONDED_BY(Incident → Team)HAS_RUNBOOK(Service → Runbook)DOCUMENTED_IN(Service/Incident → Doc)RELATED_TO(Incident ↔ Incident)INTRODUCED_BY(Incident/Service → Release/PR)
Each node carries a vector embedding derived from its LLM-generated summary.
A
Servicenode is embedded from its service summary.An
Incidentnode is embedded from its incident description.A
Runbooknode is embedded from its condensed operational steps.
Embeddings are not created from raw documents, but from these normalized, human-readable representations stored on the nodes.
At query time, the agent first uses these embeddings to locate the most relevant nodes in the graph. From there, Neo4j expands outward through edges like DEPENDS_ON and OWNED_BY, assembling the full dependency radius around the incident.
In Neo4j, this gives us two retrieval modes: semantic search over embeddings to find the right entry points, and graph traversal to expand through dependencies and ownership until we have the full dependency radius and sufficient context within the loop.
Note: This schema is also known as an ontology. It defines the vocabulary of the system and the rules by which concepts relate to each other. A well-designed ontology makes the graph predictable, extensible, and aligned with how engineers already think about production systems.
Now that we have the graph schema in place, let’s see how to maintain it.
How often does the graph need updating?
To keep things simple, build the graph once at the start by scraping your documentation sources: Confluence pages with runbooks, incident postmortems, architecture diagrams, and service dependencies. Wherever your operational knowledge lives, pull it in during initial setup.
After that, update the graph daily. Run a scheduled job each night to catch any new documentation, updated runbooks, or organizational changes. Production topology changes slowly, so daily syncs are sufficient.
What if conflicting information comes from the graph vs the MCP?
Real-time data like current metrics and active incidents comes through the MCP servers instead. The graph holds structure and history. The MCP layer holds what’s happening right now.
MCP data takes priority for the current incident. The graph holds documented structure, but MCP shows what’s actually happening right now. If GitHub MCP reports a deployment 10 minutes ago that’s not in the graph yet, the agent uses the GitHub data.
This priority can be encoded in the system prompt:
When assembling incident context, treat information sources in this order:
1. MCP servers provide current state (deployments, metrics, discussions)
2. Graph provides historical patterns and documented structure
3. If they conflict, use MCP data and note the discrepancy in your report

Flag discrepancies explicitly: "The graph shows no dependency between
service A and B, but recent deployments suggest otherwise."
An end-to-end example of applying GraphRAG
So far, GraphRAG can still feel abstract. Let’s make it concrete with a small example.
Step 1: Start with a real piece of operational text
Imagine this snippet lives in Confluence under a runbook page:
Payments API — 5xx spike after deploy
Symptoms: increased 5xx onpayments-api, elevated latency.
Recent incidents suggest the downstream cause is usuallyauth-servicethrottling.payments-apidepends onauth-serviceandledger-service.
Owner: Payments Platform team.
Mitigation: rollbackpayments-apito previous release; if error rate persists, checkauth-servicerate limits.
This is exactly the kind of “human memory” we want to keep outside people’s heads.
Step 2: Extract entities and relationships
From this text, the Graph Extractor would produce a minimal set of elements:
Entities
Service:
payments-apiService:
auth-serviceService:
ledger-serviceTeam:
Payments PlatformRunbook:
Payments API — 5xx spike after deploy
Relationships
payments-apiDEPENDS_ONauth-servicepayments-apiDEPENDS_ONledger-servicepayments-apiOWNED_BYPayments Platformpayments-apiHAS_RUNBOOKPayments API — 5xx spike after deploy
Each entity also gets a short LLM-generated summary, which is what we embed.
Step 3: Materialize it into the graph
At this point, the “elements” become real graph objects.
In Neo4j, the result looks like this (simplified):
(:Service {name: "payments-api", summary: "...", embedding: [...]})(:Team {name: "Payments Platform", oncall: "#payments-oncall", ...})(:Runbook {title: "Payments API — 5xx spike after deploy", url: "...", ...})
Connected by explicit edges like DEPENDS_ON, OWNED_BY, and HAS_RUNBOOK.
Step 4: What retrieval looks like at query time
Now, say an alert arrives:
service =
payments-apisymptom =
5xx spiketimestamp = now
GraphRAG typically runs in two phases:
1) Semantic “entry point” lookup
We first find the most relevant nodes using embeddings (e.g., “payments-api 5xx spike”).
Even if the wording differs, embeddings anchor us to the right place in the graph: payments-api, its runbook, and nearby incidents.
2) Graph expansion through dependencies and ownership
Once we have an entry node, we expand outward to capture blast radius and context.
A simple Cypher query to pull dependencies and ownership might look like:
MATCH (s:Service {name: "payments-api"})
OPTIONAL MATCH (s)-[:DEPENDS_ON]->(dep:Service)
OPTIONAL MATCH (s)-[:OWNED_BY]->(t:Team)
OPTIONAL MATCH (s)-[:HAS_RUNBOOK]->(r:Runbook)
RETURN s, collect(dep) AS dependencies, t AS owner, collect(r) AS runbooks
If we want to bound expansion by hops (to avoid exploding the subgraph), we can do:
MATCH (s:Service {name: "payments-api"})-[:DEPENDS_ON*1..2]->(dep:Service)
RETURN s, collect(DISTINCT dep) AS deps_2_hops
This is the point where GraphRAG stops behaving like a search system and starts behaving like an operational model of the organization.
We are no longer pulling “relevant documents.” We are reconstructing a slice of the system: which services are involved, how far the blast radius extends, who owns what, and which operational knowledge applies.
The retrieval step becomes an act of structural reasoning over the organization itself.
4. Deep dive into our tech stack
By now, the behavior of the system should be clear.
The difference between a diagram and a working system is the tooling. This section covers the tools we chose to implement the agent, and the tradeoffs behind them.
The guiding principle is simple:
Each component should solve one problem well and expose a stable boundary to the rest of the system.
Application Serving & Orchestration
The agent runs inside a FastAPI application, which serves as the entry point for all incoming alerts.
FastAPI is used because it is async by default and well-suited for I/O-heavy workloads. Other frameworks like Flask or Django could work, but FastAPI offers a better balance of simplicity and reliability for this pattern.
The application itself is intentionally thin.
It handles request validation and transport, then immediately hands execution to the Agent controller. No business logic lives in the web layer.
Agent behavior is coordinated by a custom Agent Controller, rather than a general-purpose agent framework.
This is a deliberate choice. Frameworks like LangChain or LangGraph are useful for prototyping, but they often hide execution order and error handling behind abstractions that become liabilities in production.
Here, the agent loop is explicit.
The controller decides when to retrieve context, when to call tools, when to invoke the model, and when to stop. Retries and limits are owned by the application itself, making behavior predictable and easier to debug during incidents.
GraphRAG Retrieval
Context retrieval happens through a Graph query engine built on Neo4j. Instead of returning isolated documents, the system retrieves connected subgraphs: clusters of services and teams along with their dependencies.
The retrieval layer can be implemented using LlamaIndex’s PropertyGraph, which provides built-in support for agentic GraphRAG queries. This gives a solid starting point for production use, while still allowing you to customize the graph schema and retrieval logic to fit incident response workflows.
Check out the reference implementation → GraphRAG with LlamaIndex
Memory and storage
Long-term memory is implemented using Neo4j vector store, with vector embeddings attached to graph nodes.
As described in the previous section, nodes and relationships only become graph objects after they are summarized. Those summaries are what we embed and store in Neo4j, such as service descriptions, incident summaries, and condensed runbook steps.
This choice reflects the nature of the data. Production knowledge is relational. Services depend on services. Teams own systems. Incidents recur in patterns. A graph database models this directly.
A pure vector database would retrieve similar text, but it cannot express ownership or dependency chains. A relational database would require rigid schemas for information that evolves constantly. Neo4j provides the right balance of flexibility and structure for this domain.
In practice, this gives us two retrieval modes:
semantic search over embeddings to find the right entry points
graph traversal to expand through dependencies and ownership
The embeddings tell the system where to start.
The graph tells it what else matters.
The Language Model
The language model used is Gemini, accessed through the LLM Gateway.
Gemini was chosen primarily for pragmatic reasons. The free tier provides enough room for experimentation, and the stateful chat API makes it well-suited for multi-step workflows that involve tool calls and iterative reasoning.
The gateway abstracts away model-specific details, handling prompt construction, retries, and configuration. This makes it possible to swap Gemini for another provider later without rewriting the agent logic.
Observability & Evaluation
As usual, we recommend using Opik for observability and evaluation.
Opik captures prompt traces, retrieval steps, tool calls, and model outputs as a single execution trace, making agent behavior inspectable end to end.
For a GraphRAG-based on-call agent, this is essential. It allows us to see what context was retrieved from the graph, which tools were invoked, and how the final incident report was produced. Opik also supports replaying and comparing runs, which helps evaluate changes to prompts, retrieval strategies, or graph structure.
This makes Opik a natural fit for operating and iterating on agents in production.
Conclusion
On-call is not hard because engineers cannot fix things.
It is hard because context is scattered. Ownership is unclear. Dependencies are implicit. The “why” lives in old Slack threads and half-written runbooks.
This is exactly the gap a Production Engineer agent can close.
Not by becoming a smarter reasoner, but by being grounded in the right kind of context. GraphRAG turns organizational knowledge into a connected system the agent can traverse: services, teams, dependencies, incidents, and the artifacts that explain them.
The rest is engineering discipline.
Keep orchestration explicit. Use a graph database when the domain is relational. Instrument everything with LLMOps from day one.
Start simple. Build the graph. Wire retrieval. Add only the tools you need.
That is how you get from a 02:13 pager to an actionable incident report—before the on-call engineer opens their laptop.
See you next Tuesday.
Anca Muscalagiu
The views expressed are my own and do not represent my employer.
What’s your opinion? Do you agree, disagree, or is there something I missed?
Enjoyed the article? The most sincere compliment is to share our work.
Whenever you’re ready, here is how I can help you
Go from agent user to agent builder. Master the foundations of AI agents and turn fragile demo code into reliable, production-ready systems with my course, Agent Engineering: Building Multi-Agent Systems (made with Towards AI).
35 lessons. Pure foundations from scratch. 4 mini-projects. 2 production systems. A certificate and direct access to me & industry experts in our Discord.
Built for software and data professionals transitioning into AI engineering. Rated 5/5 with 300+ students. The first 7 lessons are free:
Not ready to commit? Start with our free Agent AI Engineering Guide, a 6-day email course on the mistakes that silently break AI agents in production.
Thanks again to Opik (by Comet) for sponsoring the series and keeping it free!

If you want to monitor, evaluate and optimize your AI workflows and agents:
References
Zilliz Learn. (n.d.). GraphRAG explained: Enhancing RAG with knowledge graphs. Medium.
https://medium.com/%40zilliz_learn/graphrag-explained-enhancing-rag-with-knowledge-graphs-3312065f99e1LlamaIndex. (n.d.). Agentic GraphRAG with property graphs. LlamaIndex Documentation.
https://developers.llamaindex.ai/python/examples/property_graph/agentic_graph_rag_vertex/JingleMind. (n.d.). Mastering advanced RAG methods: GraphRAG with Neo4j implementation using LangChain. Medium.
https://medium.com/@jinglemind.dev/mastering-advanced-rag-methods-graphrag-with-neo4j-implementation-with-langchain-42b8f1d05246Comet ML. (n.d.). Evaluate your LLM application | Opik Documentation. Comet. https://www.comet.com/docs/opik/evaluation/evaluate_your_llm
Comet ML. (n.d.). Open‑source LLM Evaluation Platform | Opik by Comet. Comet. https://www.comet.com/site/products/opik/
Images
If not otherwise stated, all images are created by the author.
Love this article, Anca!
Thanks for the good 😊