


Every AI application that wraps an agent is a harness!
In LangChain’s Terminal-Bench experiment, changing only the harness (with the same model) moved a coding agent from ~30th place into the top 5: the harness, not the model, is what makes a coding agent good.
In the open-source course Building a Coding Agent From Scratch, you’ll build that harness from scratch in Python: Decode, a complete coding agent that grows lesson by lesson from a bare agent loop into a swarm of remote agents running in parallel in the cloud.
Why? You’ll be able to engineer custom harnesses for your own AI products (the skill behind that leaderboard jump), and you’ll understand what Claude Code and Codex actually do under the hood, turning you into a power user.
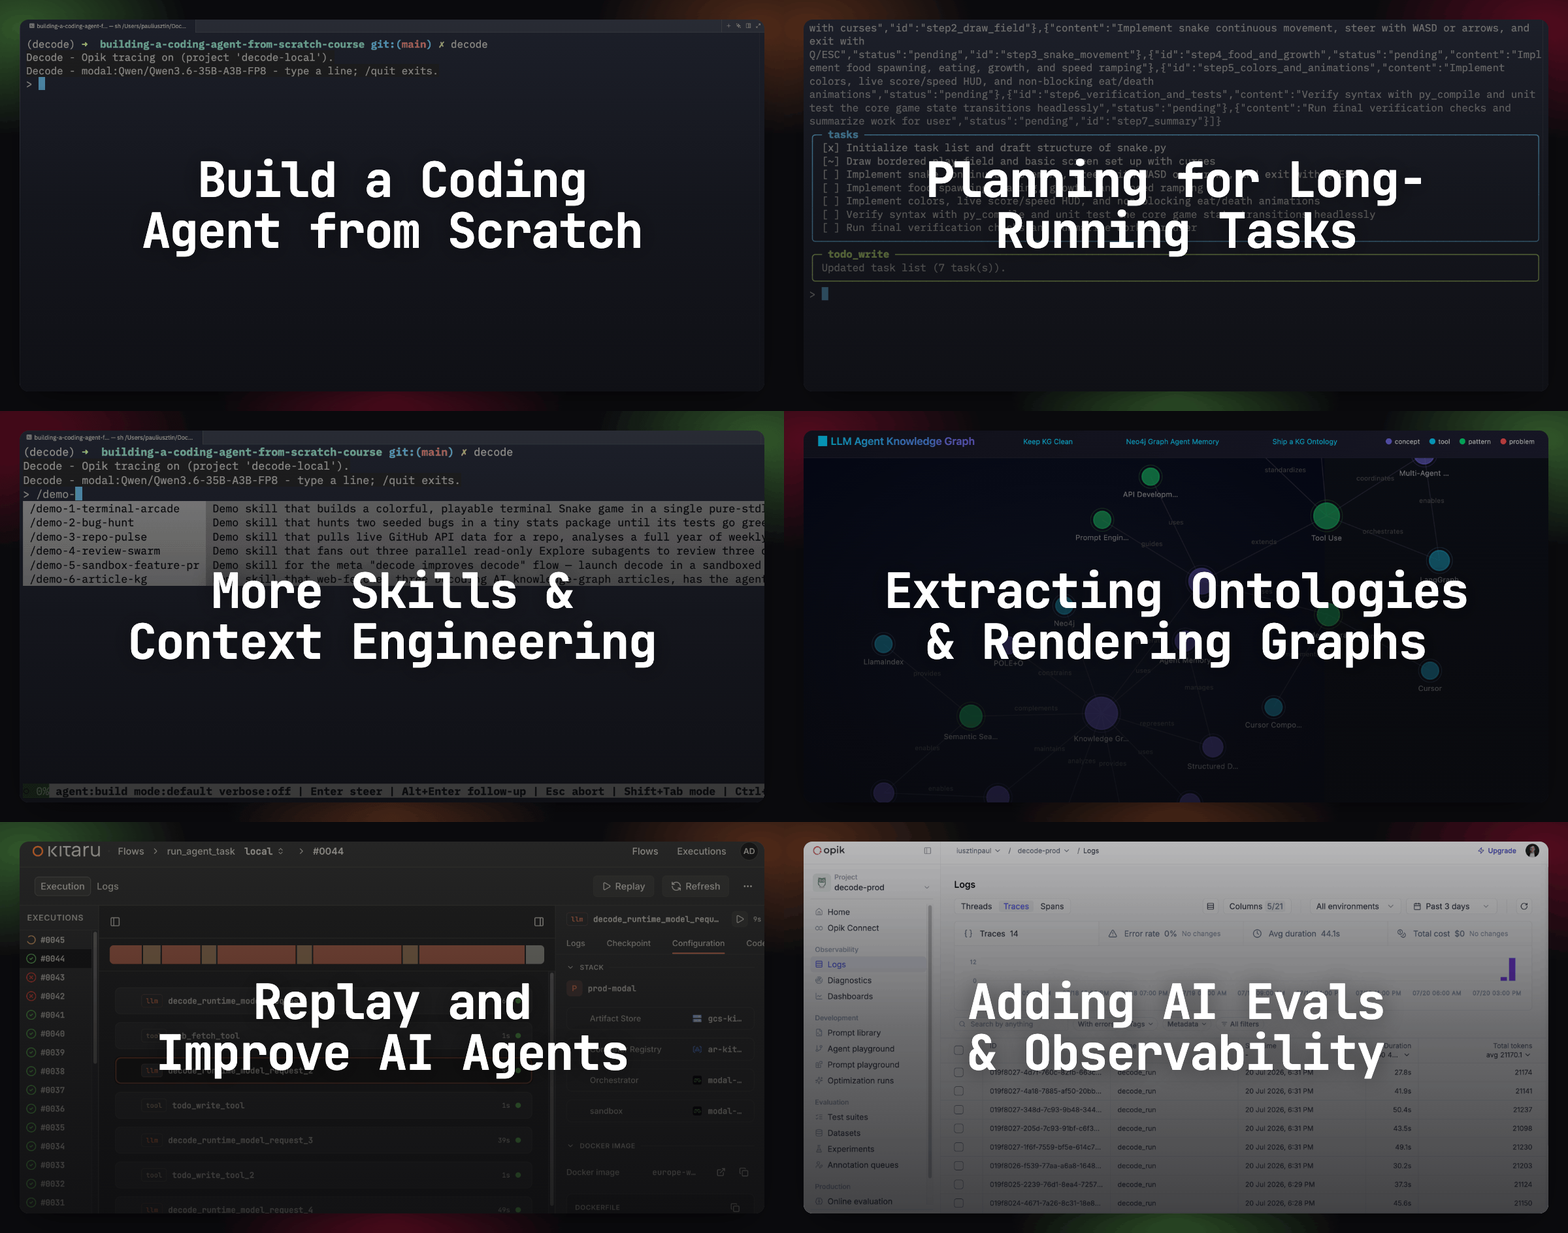
Lessons:
Turn Your Agent’s Failures Into a Regression Suite ← you are here
Special thanks to Modal, Opik (by Comet), and Kitaru (by ZenML) for sponsoring this open-source course and keeping it free!
Lesson 8: Turn Your Agent’s Failures Into a Regression Suite

Here I am, at 10 p.m., creating my implementation plan for my software factory. Tired, I vibe-planned more than usual, using Claude Code to implement Decode’s evals layer via my Modal serverless endpoint so I could access all the necessary LLMs. The endpoint returned a 503 before it finished warming up, and instead of stopping, the coding agent found a Gemini API key in memory and decided to use it to achieve its goal no matter what. The result: 40 of tokens burned on 20 benchmark tests by the next morning, compared to4 to $5 on Modal. Ouch.
The fix was extremely simple, just 2 lines: wait for the warm-up and properly guard my credentials from the env vars. The hard part is guaranteeing that the same error never happens again after the next prompt, tool, or model change.
Without that guarantee, you’re afraid to change your prompts, because the chance of breaking what worked last week without noticing is too high. That slows development down, especially in larger teams where you have to touch other people’s code.
💡 The answer to all our problems is regression tests (the suite you re-run after every change to prove earlier behavior still holds), which are the most important part of AI evals for a custom AI app, more than benchmarks or online monitoring. They let you ship more features while being sure nothing else broke, just like the unit, integration, and regression tests of traditional software.
For an agent, the best way to organically grow your regression tests without spending too much time guessing them or money on testing useless errors is the error analysis framework.
To apply the error analysis framework to your production or synthetic traces, you need to build an eval harness that runs your agents in parallel in isolated containers, emulates the right context for each test, and collects the outputs from all your tests.
For that, there is a new family of tools in town, such as Kitaru by ZenML Labs, focused on capturing your agent runs and replaying them with the same context so you can easily reproduce bugs, fix your code, and grow and manage your regression tests.
First, you’ll get a strong intuition for how the error analysis framework works, then you’ll apply it to fix and build regression tests on top of Decode, the Claude Code clone we’ve built during this series. This article will make sense even if you haven’t read previous lessons. Still, reading Lesson 7 on Agent Evals 101 would definitely help you get the foundations of evals.
Regression tests via the error analysis framework
Every change to a coding agent mixes plain English (prompts, tool descriptions, skills) and code: tool implementations, harness components, the sandbox layer (the container its bash and file tools run in), and compaction. So implementing unit/integration tests as we know them won’t work for three reasons: it’s impossible to write unit tests for prompts, writing integration tests for too many scenarios is too costly, and you can’t assert unstructured data via code.
What works is the error analysis framework, popularized by Hamel Husain and Andrew Ng.
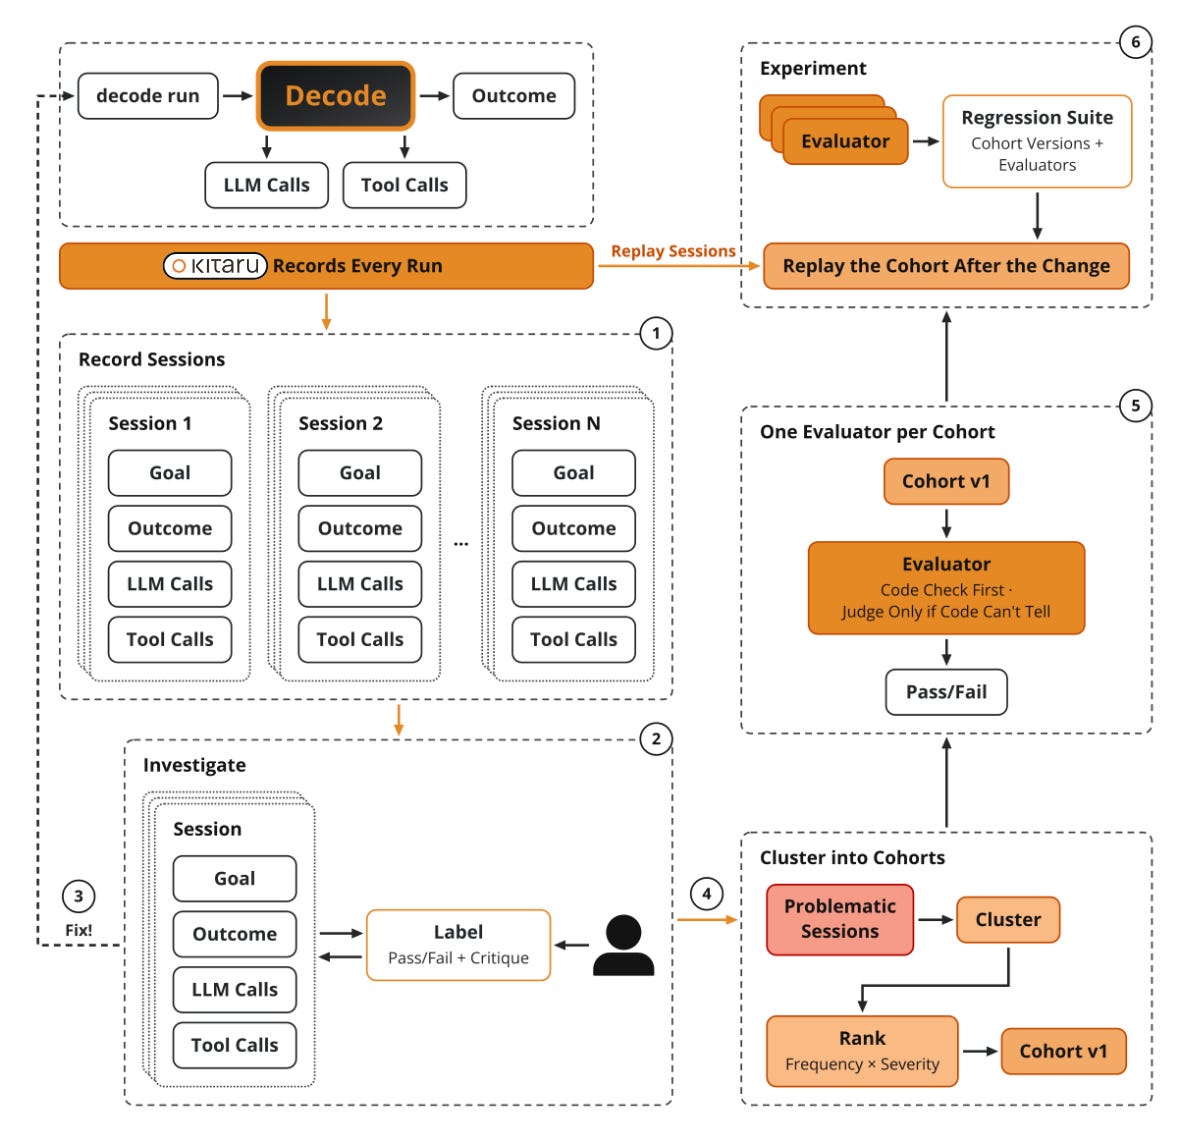
Here is how error analysis works, step-by-step.
You record real runs, read a sample by hand, and give each a pass/fail label with a short critique, never a 1-to-5 score, because a “fail” (instead of a “pass”) is actionable, while a “3” (instead of a “2” or “4”) is not. You fix the obvious right away, cluster the rest by failure type, rank by frequency × severity, and run a root cause analysis (tracing one failing run back to the step that broke it) on each high-priority cluster. Then you write one cheap evaluator per cluster and re-run it after every change.
Hamel Husain calls it “the most important activity in evals” because it decides which evals to write at all, and Anthropic’s field guide sets the entry bar low: “20-50 simple tasks drawn from real failures is a great start”.
Error analysis sounds powerful, but how do we do it in practice? How do we look at our data, cluster it and run evaluators?
That’s what we will show you in this lesson, using Kitaru.
When evaluating Decode, you record isolated decode run executions (Decode’s headless command) as sessions, with every LLM and tool call included. One Kitaru session maps to one Decode session, similar to threads or a collection of traces from other tools. Or, in plain English, your end-to-end conversation with an agent is a session. More here.
Ideally, you already have Kitaru plugged in while running your AI app in production. Otherwise, you can easily import all your data from observability tools like Opik, Braintrust, or Langfuse.
Next, you sample ~20-30 sessions into an investigation, label each session as pass/fail, and add a short critique message. For errors, the message should contain the first failure reason.
After that, because Kitaru connects to your coding agent through its MCP server and skills, the agent knows how to cluster the problematic ones by error type into cohorts. For each cohort, you will implement one evaluator, a few lines of Python that read a session and say pass or fail. You fix the code, then start an experiment that replays every session of the cohort with the fix in place.
The power of Kitaru is in its replay mechanism. Why? When implementing the eval harness, one of the hardest parts is recreating the same context for each task you want to evaluate. Via replays, you inject that context automatically by caching the tool outputs of the session you want to replay. This means that if a tool gets the same input, it returns the same output. Tool calls with different arguments, or tools changed during your fix, run from scratch.
Now let’s plug Kitaru into Decode’s harness to record, review and replay its agent loop.
Integrating Kitaru into the agent harness
Sessions can get into Kitaru in three different ways:
Kitaru is already plugged into your harness
You import sessions from an observability tool like Opik
You run experiments via Kitaru after fixing a bug or implementing a feature
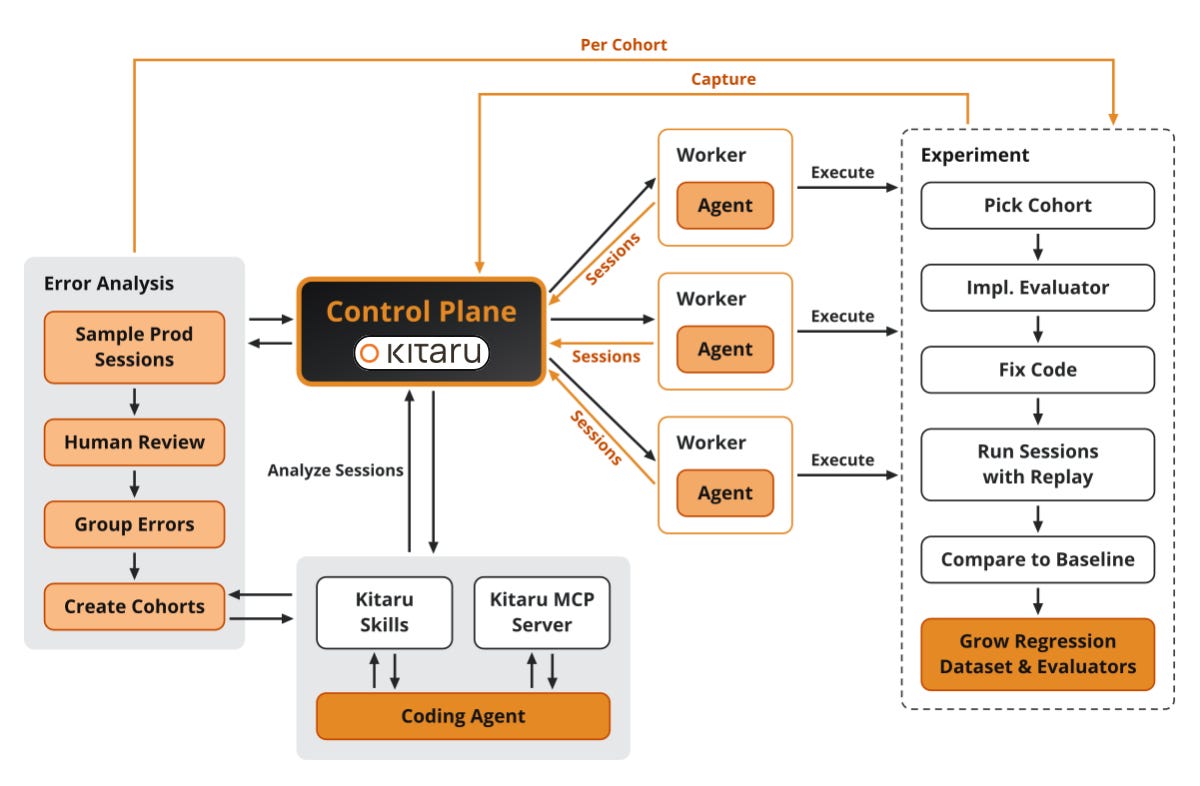
In all three methods, everything is ingested into Kitaru’s control plane. Your coding agent talks to that control plane to do the error analysis, and experiments replay sessions on workers that you host yourself.
From an architectural perspective, 4 components talk to each other:
Decode is the agent under test, available in the series repo.
The Kitaru control plane stores sessions and tracks the error analysis: local open-source via Docker Compose, managed, or self-hosted.
The Kitaru workers run Decode in isolated containers: via Docker when running locally, as Modal serverless apps when deployed, or any other method you prefer. The idea is that everything runs on your infra, and Kitaru doesn’t manage it.
Your coding agent (Claude Code, Pi, Codex) does the error analysis through the Kitaru MCP server (the repo’s
.mcp.json), guided by 3 Kitaru skills:kitaru-investigation,kitaru-validate-evaluator,kitaru-replay-experiment.
A worker, when executing an experiment or a replay, pulls each job on your infra and spawns one isolated Decode per session.
In the code snippet below, we can see how Decode plugs into our Pydantic AI agent using the wrap_for_recording function, which wraps the agent using KitaruAgent only when recording is configured, with no Kitaru import on the bare path.
It probes the workspace once, so an unreachable Kitaru server degrades to an unrecorded run with one warning line. The one exception the block leaves out is a replay spawned by a Kitaru worker, where the same failure is fatal because an unrecorded replay would waste tokens.
From src/decode/runtime/recording.py:
async def wrap_for_recording[DepsT, OutputT](
    agent: AbstractAgent[DepsT, OutputT], *, session_name: str | None = None
) -> tuple[AbstractAgent[DepsT, OutputT], str | None]:
    if not recording_is_configured():
    # KITARU_AGENT_ID + KITARU_API_URL, else the bare agent
        return agent, None

    export_kitaru_api_url()
    try:
        agent_id = _configured_agent_id()
        ...
        await _probe_workspace(agent_id)
        # Ping the workspace ONCE, before the run burns tokens
        from kitaru_pydantic_ai import KitaruAgent

        wrapped = KitaruAgent(agent, agent_id=agent_id, session_name=session_name)
    except Exception as error:
    # Broad on purpose: ANY setup failure degrades to the bare agent
        ...
        notice = (
            f"[kitaru] not recording this run: {_workspace_label()} is unavailable "
            f"({one_line(error)}); continuing on the bare agent"
        )
        logger.warning("%s", notice)
        return agent, notice

    ...
    return wrapped, None
And this is how we call it, from src/decode/runtime/headless.py:
agent, recording_notice = await wrap_for_recording(
    _build_headless_agent(model), session_name=session_id
)
session_name is Decode’s own session id, so a Kitaru session and its Opik trace thread share one id, which is what makes the Opik import in the next section a one-to-one mapping.
With everything in place, let’s run the framework end to end.
From 30 runs to a regression suite
You need a mix of at least 20 to 30 sessions to see the agent loop in action. Either run decode run "<goal>" yourself, or let make kitaru-seed record 30 runs in ~10 minutes. You get 14 good sessions and 2 intentionally introduced error clusters: 8 cut off by --max-requests 1, and 8 crashed on a bogus model or a broken provider. The seed emulates 2 common errors we hit while developing Decode and stores all the threads in Opik.
You can find all the commands on how to replicate our experiment in our GitHub runbook.
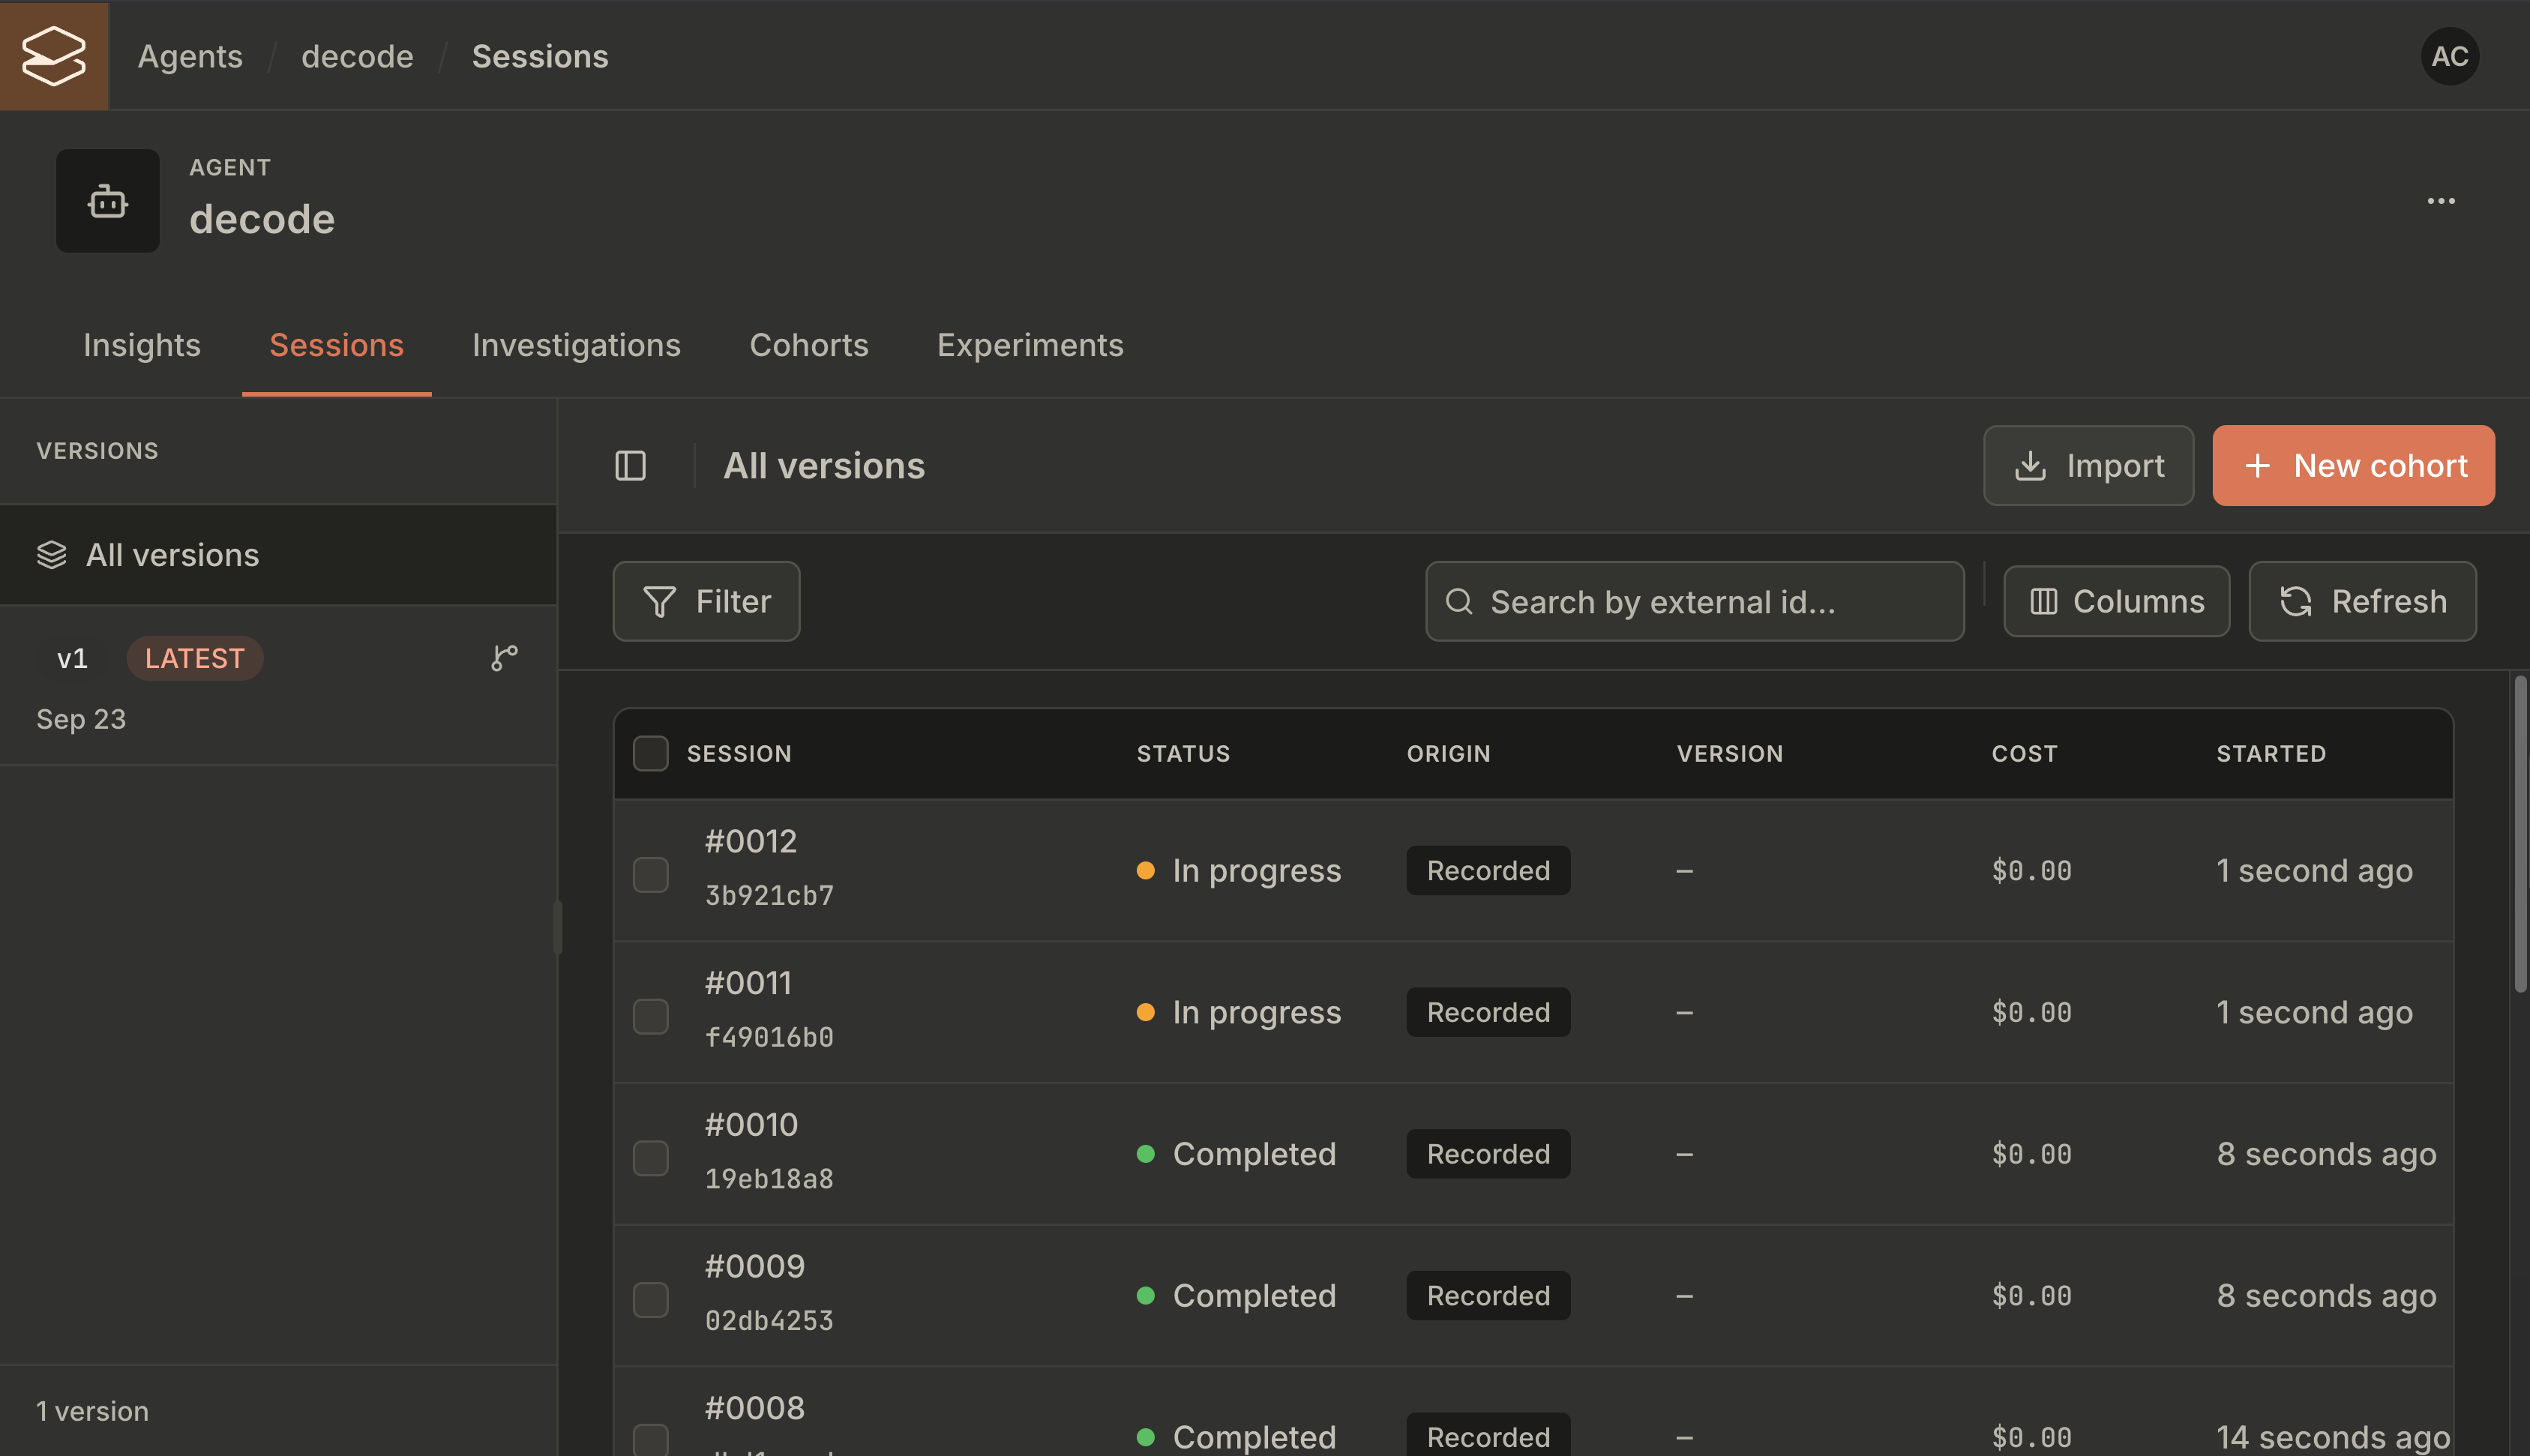
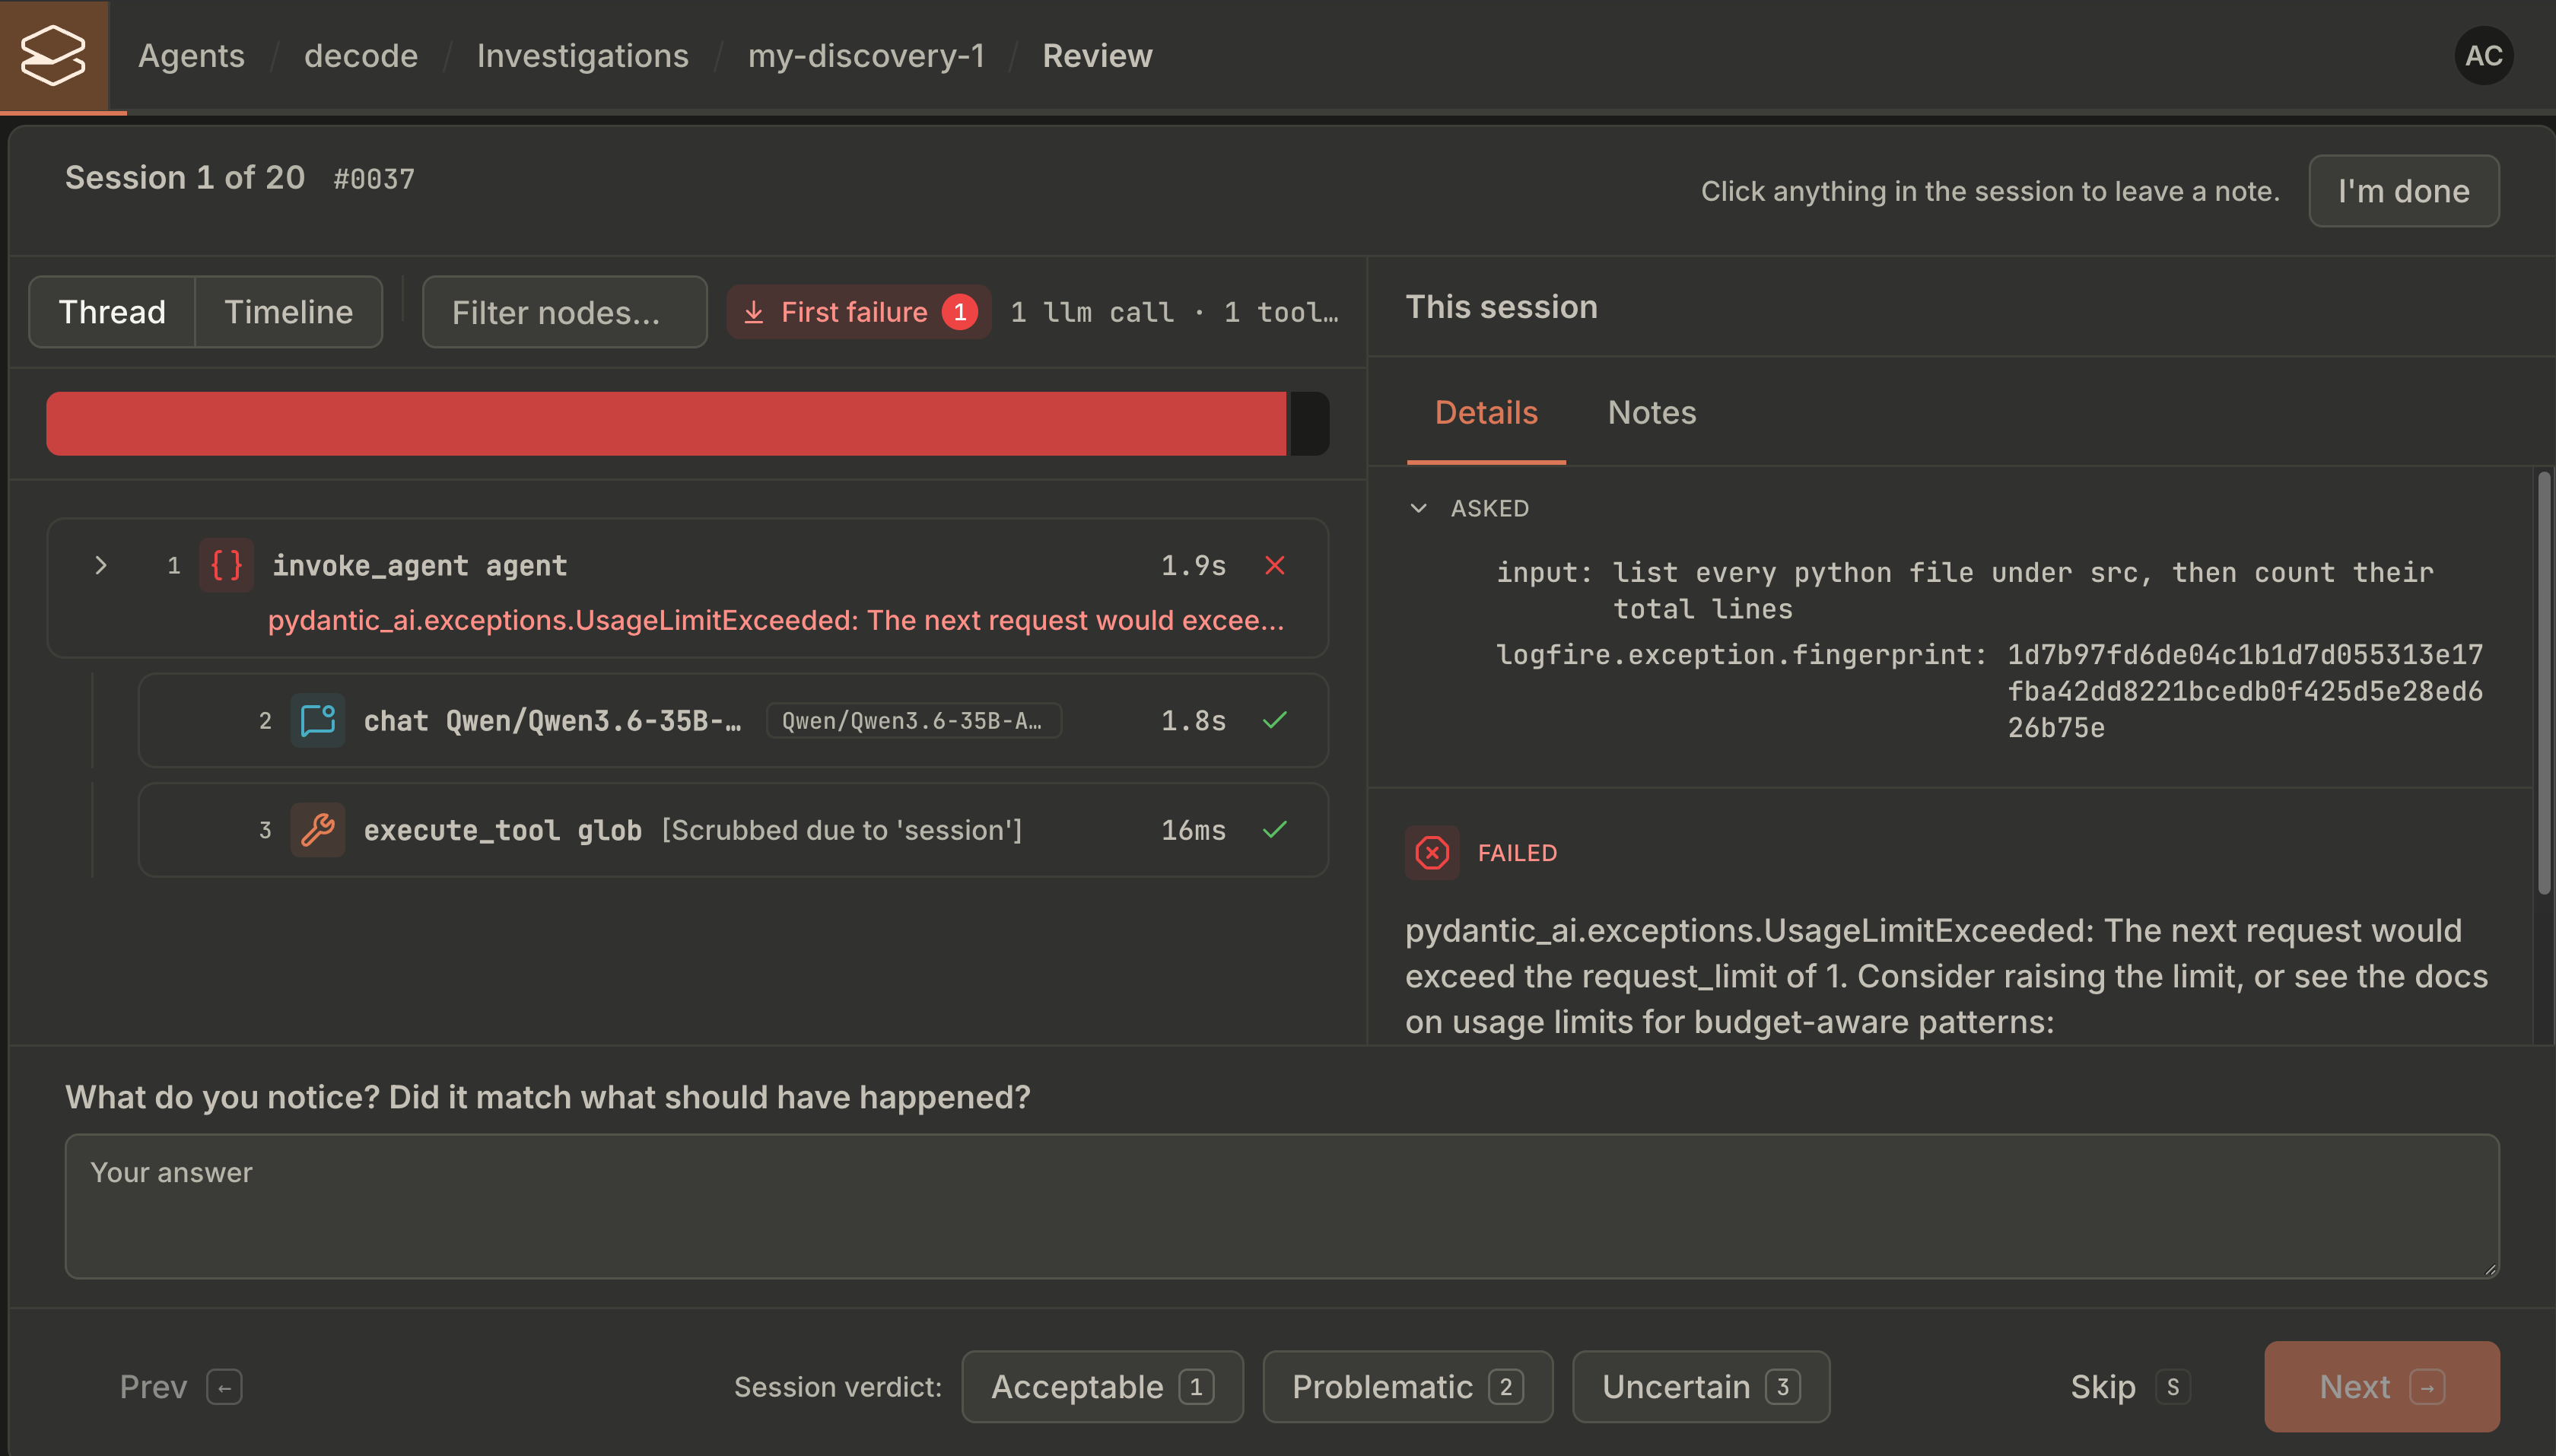
You sample 20 of the newest 30 sessions into an investigation. For each one, you ask, “What do you notice? Did it match what should have happened?” and label it in the UI as acceptable, problematic, or uncertain, plus an optional critique.
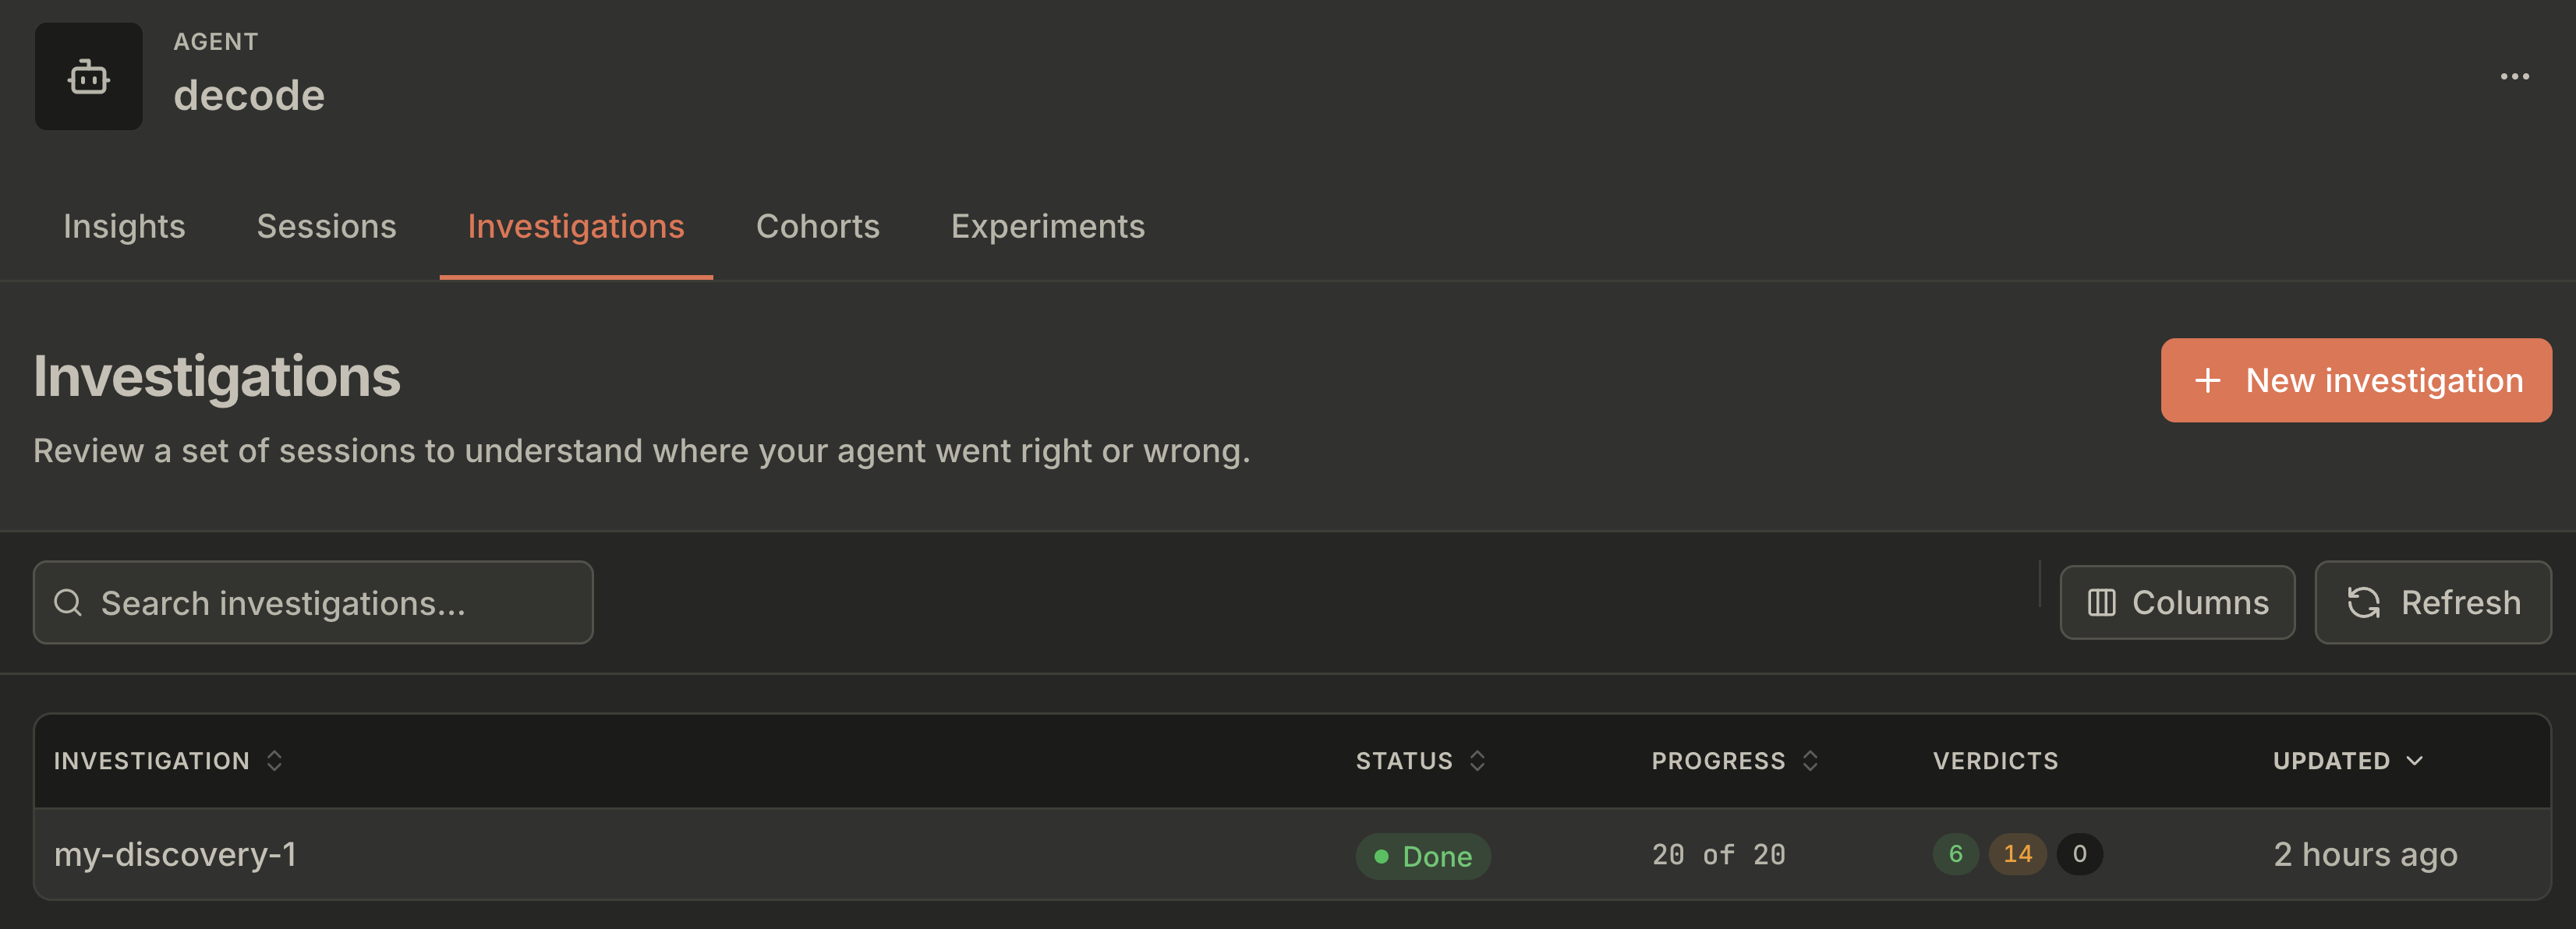
I had 6 acceptable, 14 problematic, and 0 uncertain, which the investigations tab sums up in one row:
After wrapping up the investigation, the UI hands you a prompt to paste into a coding agent with the Kitaru skills and MCP server hooked up. I used Opus 5.5:
Investigation complete: my-discovery-1. 20 of 20 sessions reviewed, agent: decode.
Reviewed 23 September 2026.

Verdicts: 6 acceptable, 14 problematic, 0 uncertain.

Choose what to do next:
1. Build a cohort from a behavior found in these reviewed sessions.
2. Investigate the 14 problematic sessions in more detail.
Running the prompt finds 2 cohort candidates by error type: a run that hits the request limit and ends on a raw UsageLimitExceeded (the error Decode raises when a run hits its request cap) with no output, and a connection error, which it suggests rejecting as agent behavior. You answer “Create a cohort for each candidate!” and get 2 cohorts.
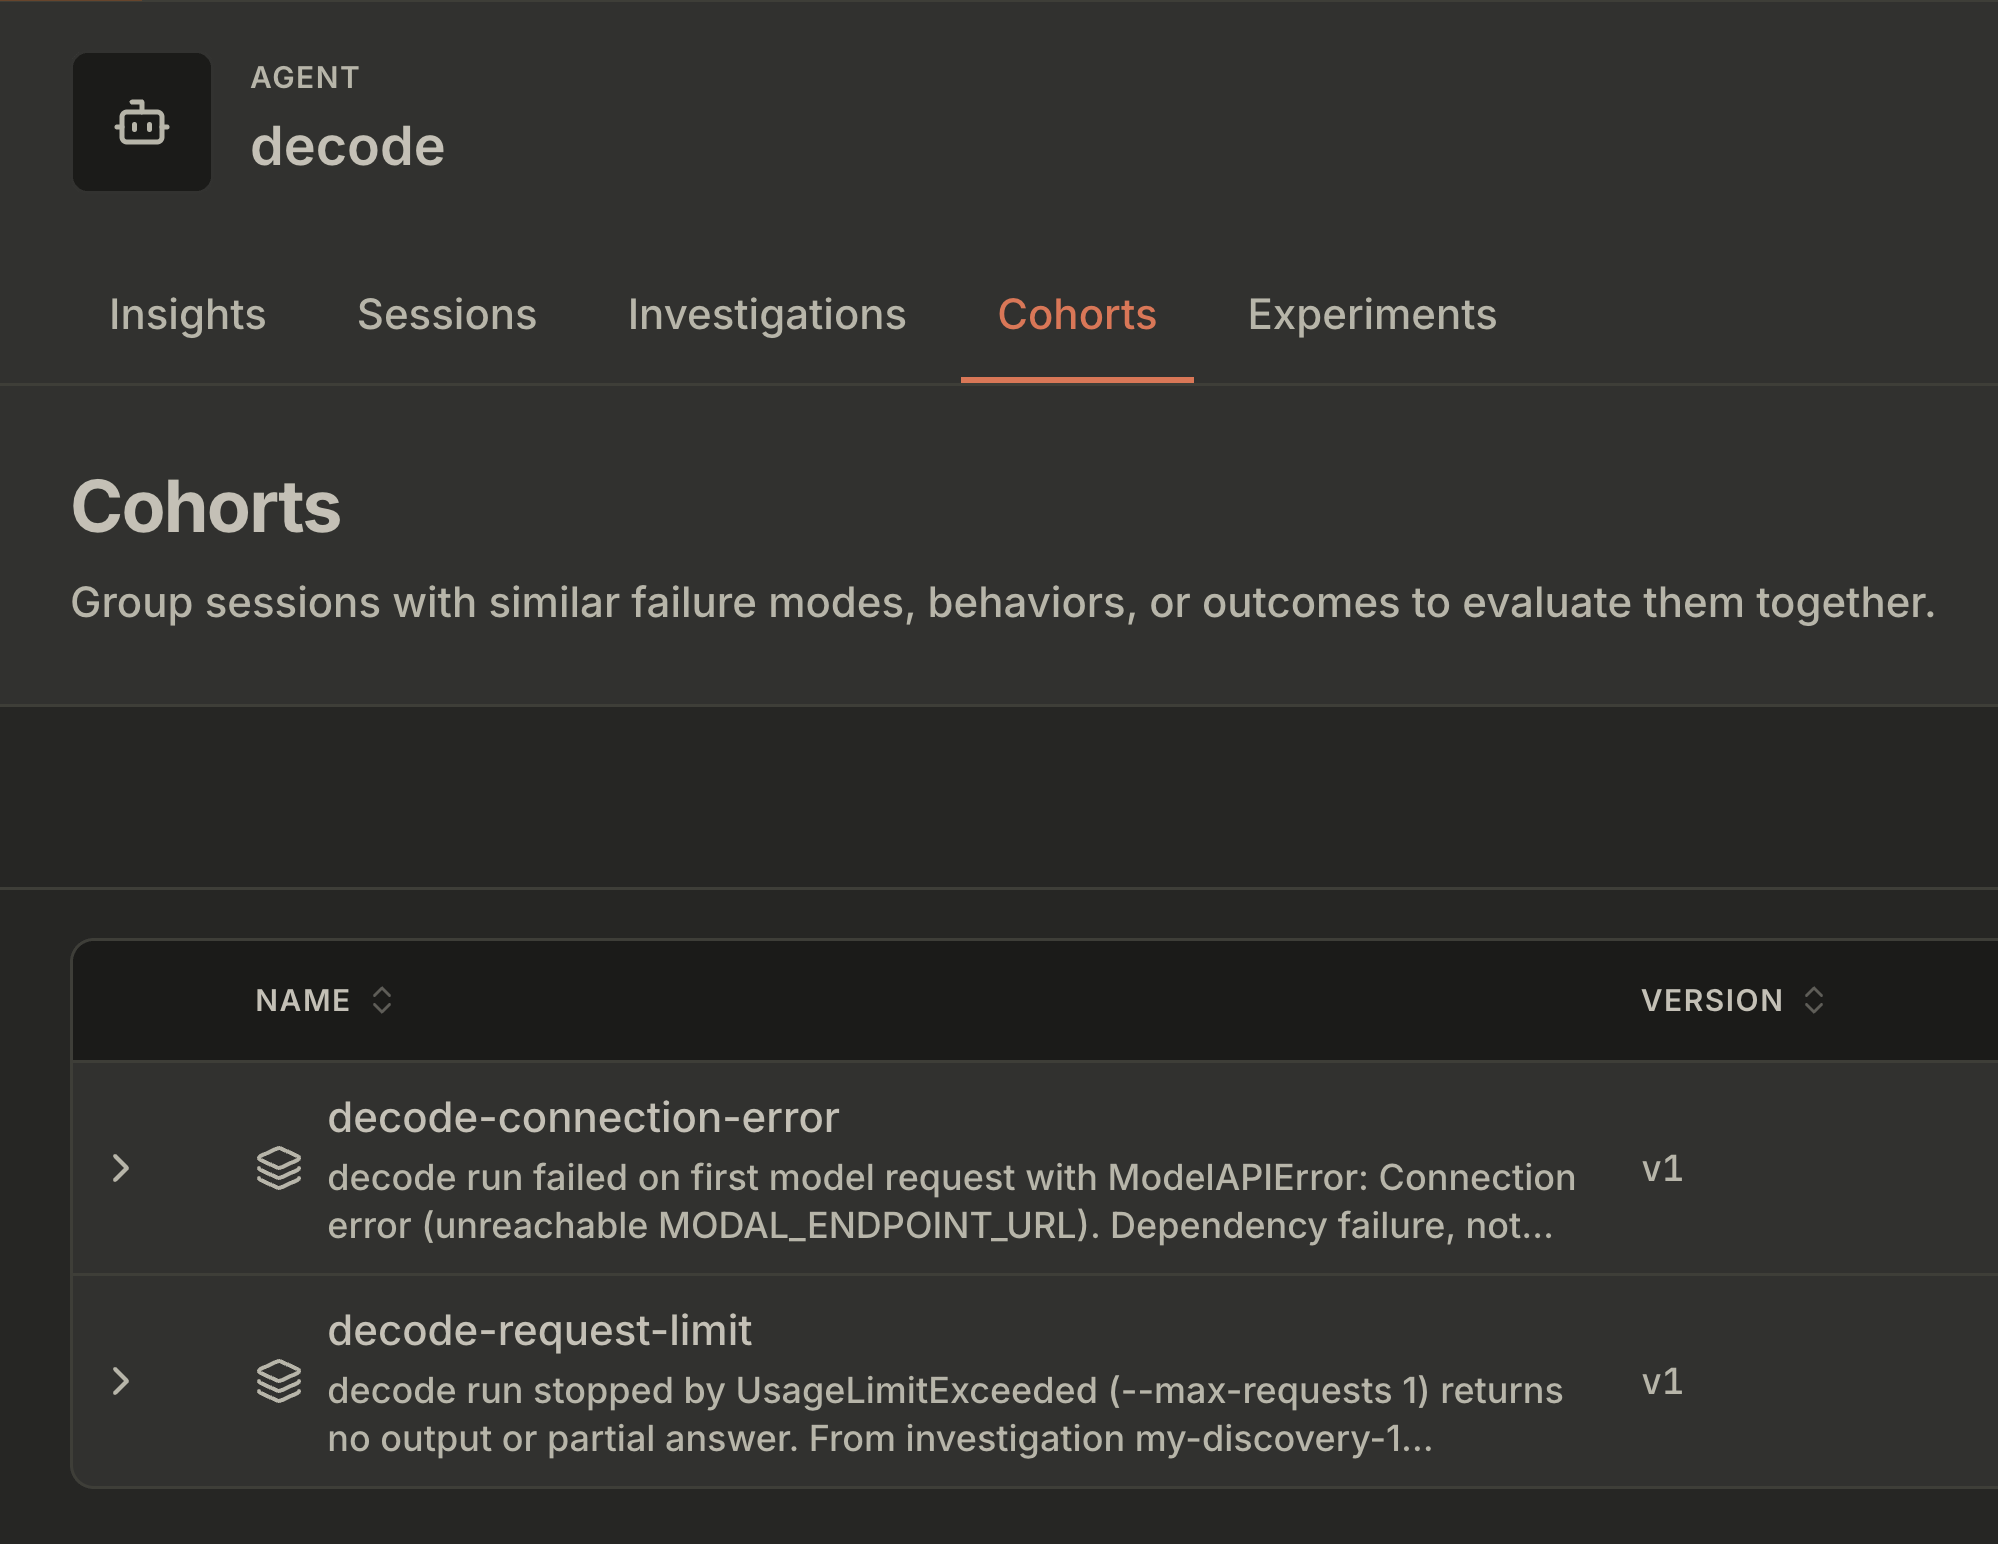
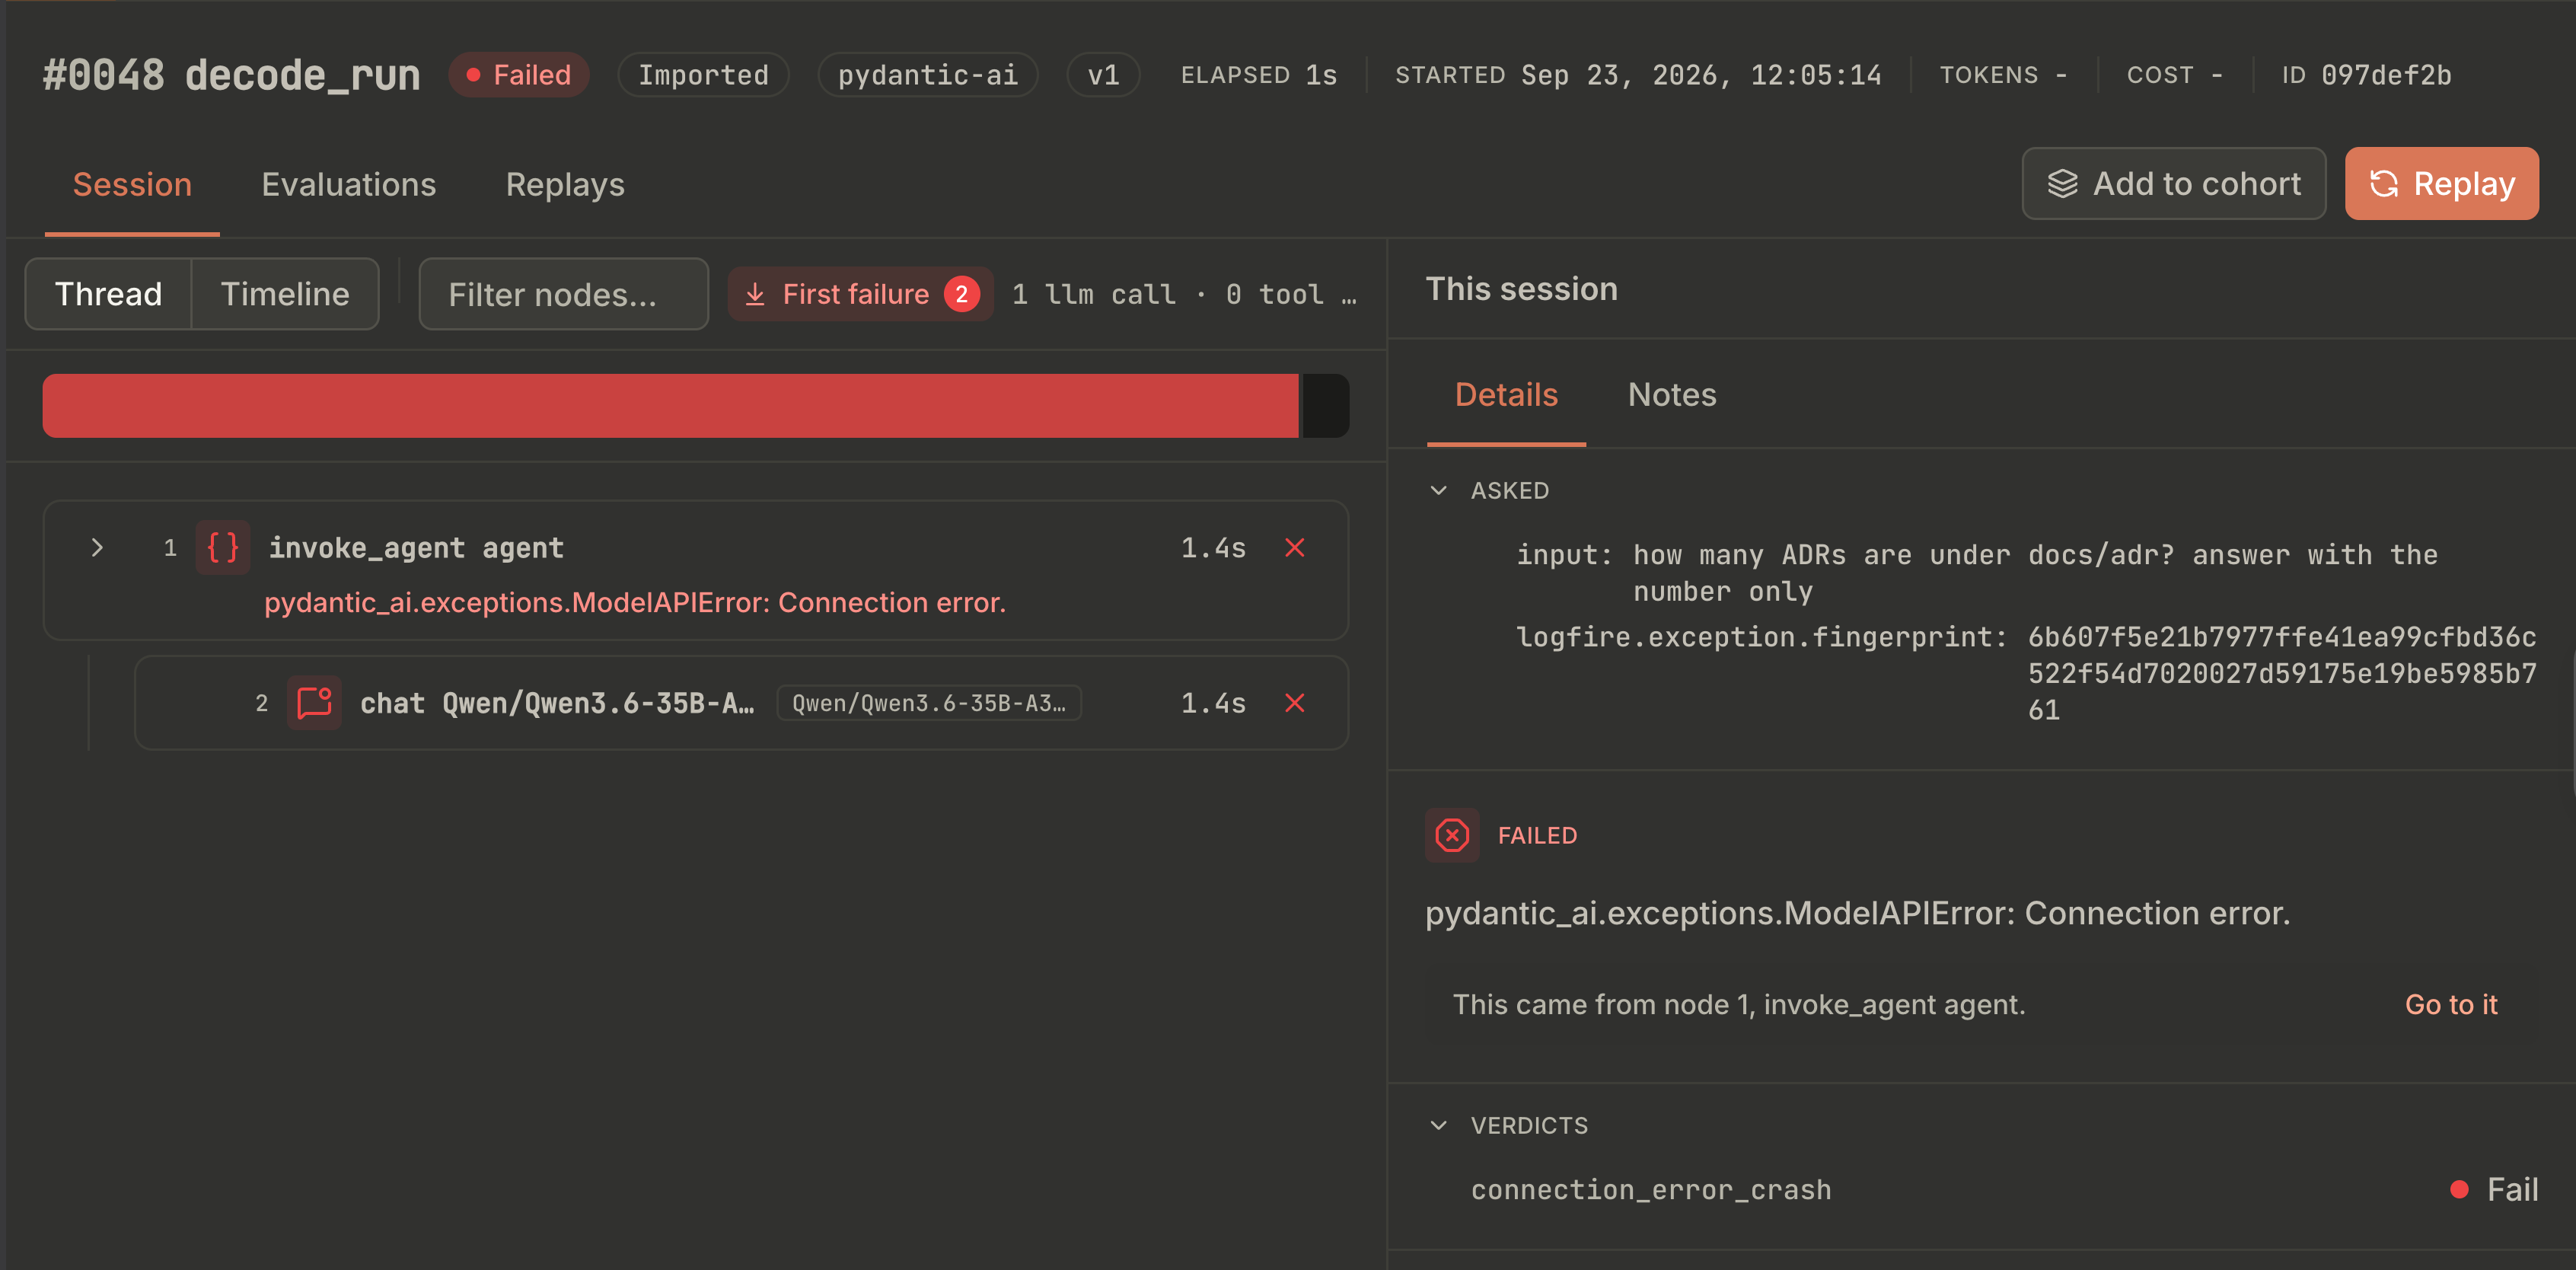
You either apply an existing evaluator or create one per cohort. We have one of each: decode_connection_error.py for the connection-error cohort and decode_request_limit.py for the request-limit cohort. A new failure class needs a new evaluator, which is easy because the cohort holds every session’s logs and errors, providing enough context to your coding agent.
💡 We always prioritize code checks over LLM judges. They are cheap, fast, and need no maintenance, while a judge needs labeled examples and calibration first. A judge is always the last resort.
Both evaluators read the session’s terminal error and flag the marker they own, and a non-terminal session with no error returns passed=None, never a silent fail. The evaluator fails when the failure class is present, so a cohort session fails until the code is properly fixed or the bug is accidentally reintroduced.
Anthropic warns that checking an exact tool-call sequence is “too rigid”, so check the overall contract, such as the outcome or a hard constraint like “the run must not end on this error”.
From evaluators/decode_connection_error.py:
from typing import Any

from kitaru.task.evaluator import EvaluationResult, SessionView

_RESULT_NAME = "connection_error_crash"
_MARKERS = ("Connection error", "ConnectError")


def evaluate(session: SessionView, **params: Any) -> EvaluationResult | list[EvaluationResult]:
    record = session.session
    error = record.error or ""

    if not error and str(record.status or "") == "in_progress":
        return EvaluationResult(
            name=_RESULT_NAME,
            passed=None,
            value="unresolved",
            explanation="Session is non-terminal with no error; evidence missing.",
        )

    detected = any(marker in error for marker in _MARKERS)
    explanation = (
        "Terminal error is a connection failure: the provider endpoint was unreachable."
        if detected
        else "No connection failure: the session has no error or failed for another reason."
    )
    return EvaluationResult(
        name=_RESULT_NAME, score=detected, passed=not detected, explanation=explanation
    )
The decode_request_limit evaluator, from evaluators/decode_request_limit.py, has the same Python logic, but with different markers:
_RESULT_NAME = "request_limit_cutoff"
_MARKERS = ("UsageLimitExceeded", "exceed the request_limit")
You prompt the coding agent to apply the 2 evaluators, one per cohort. Each session fails because it still contains the error.
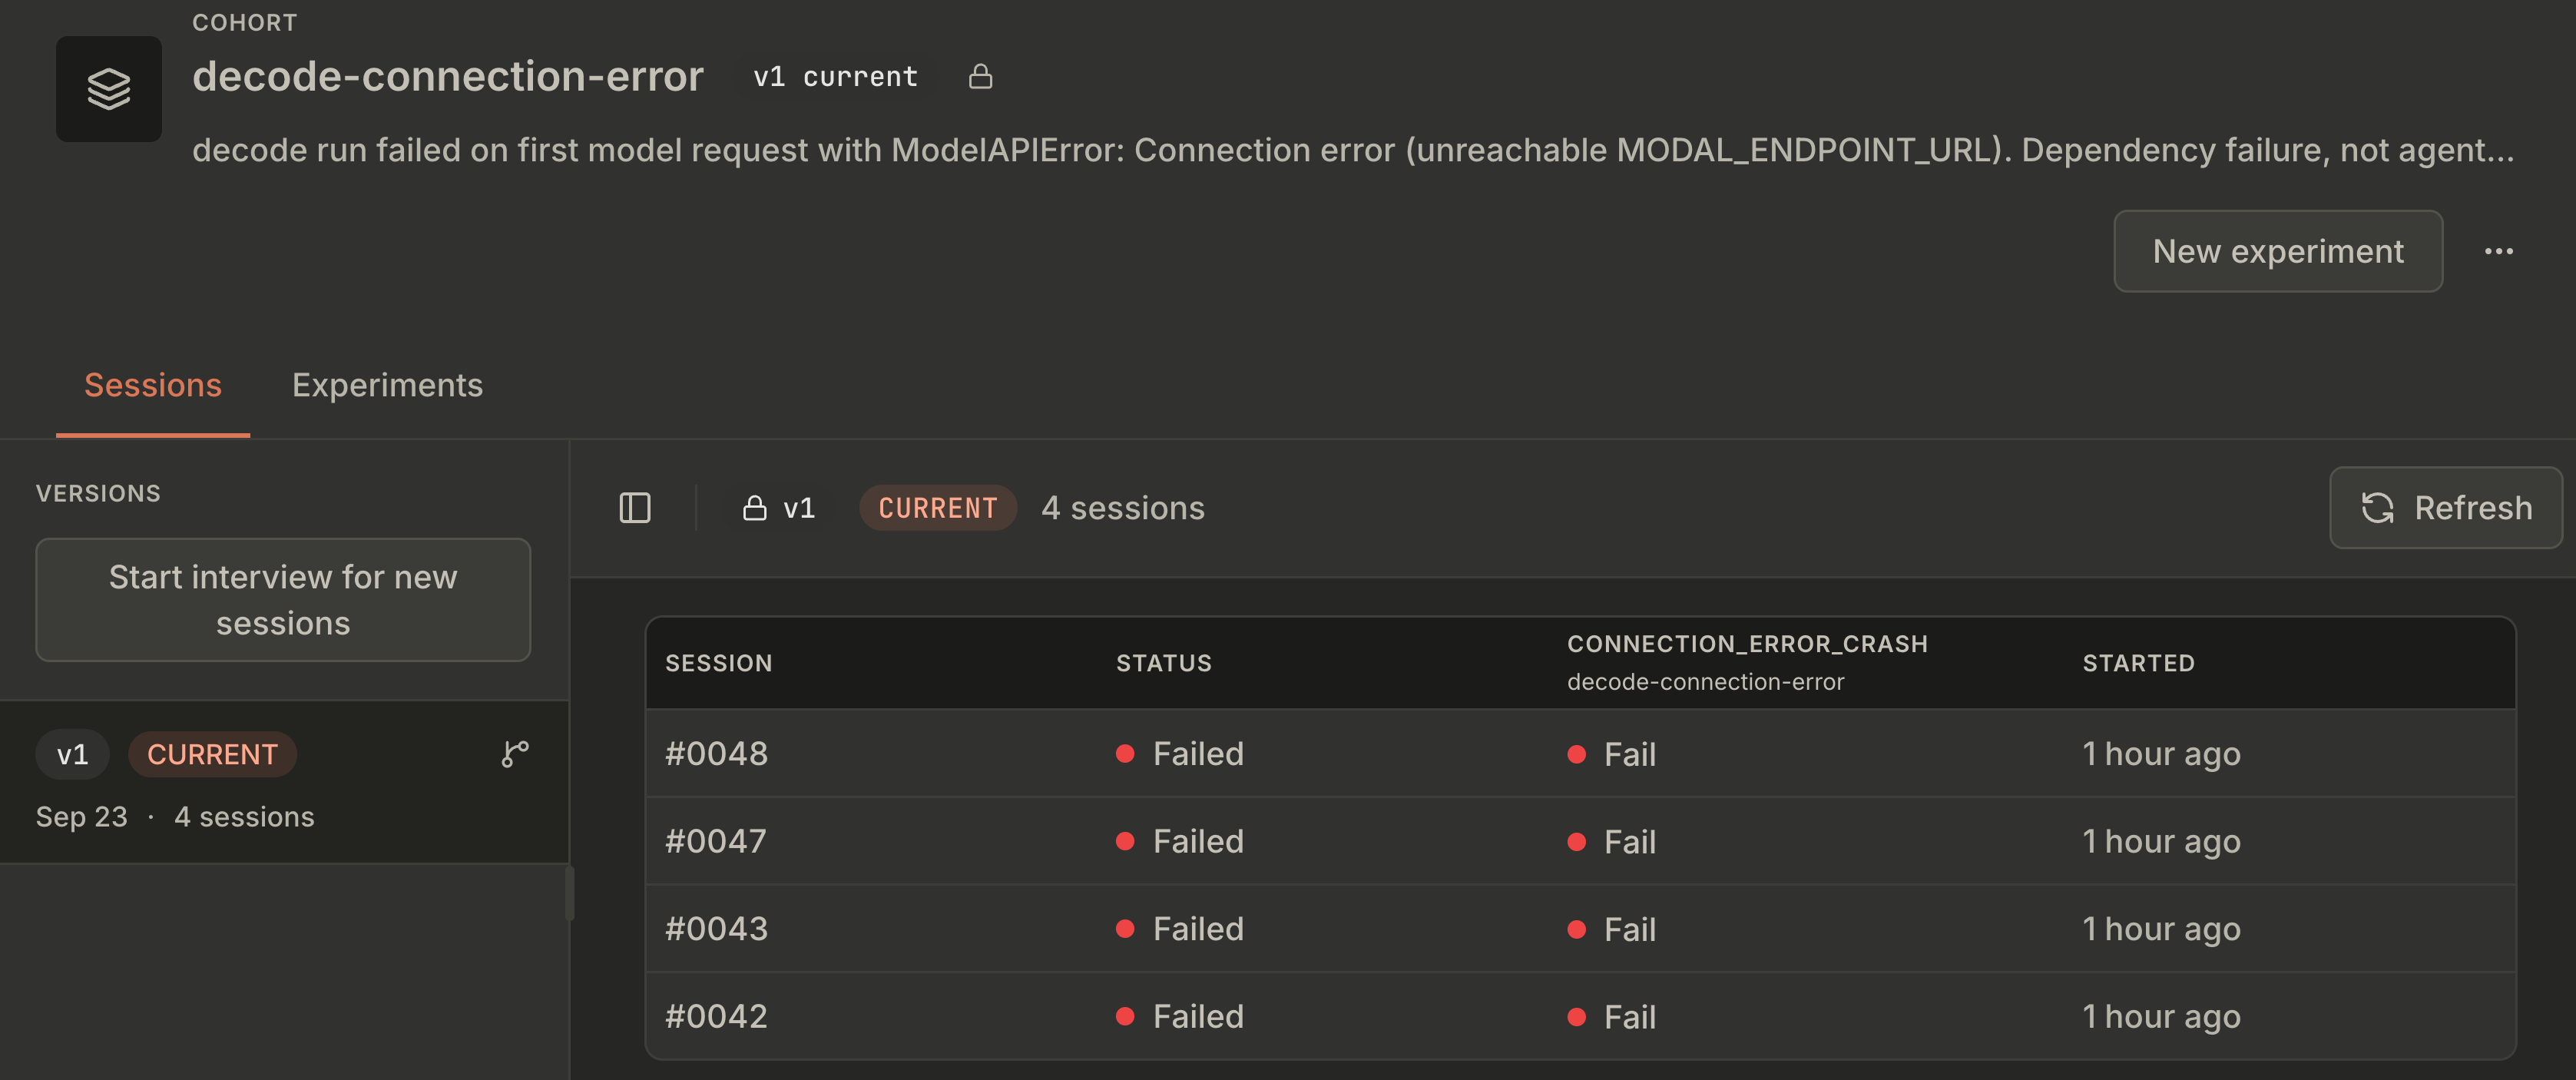
Now you run a root cause analysis on one cohort session and fix the code behind it. Ours was artificially injected by the seed, so we know the rerun will pass. In a real scenario, you fix the code first.
This cohort is the failure class of my 503 error due to the missing warm-up logic when running my models on Modal, now frozen as 4 replayable sessions. After fixing the bug, you prompt, in the same session: “For cohort decode-connection-error we fixed the connection error. Start an experiment based on the sessions from the cohort, rerun the evaluator and see if the failure class has been resolved.”
Kitaru replays every cohort session on a worker in an isolated Decode instance, from the original prompt. These baselines crashed before their first tool call, so the experiment’s tool policy (next section) lets tools run for real.
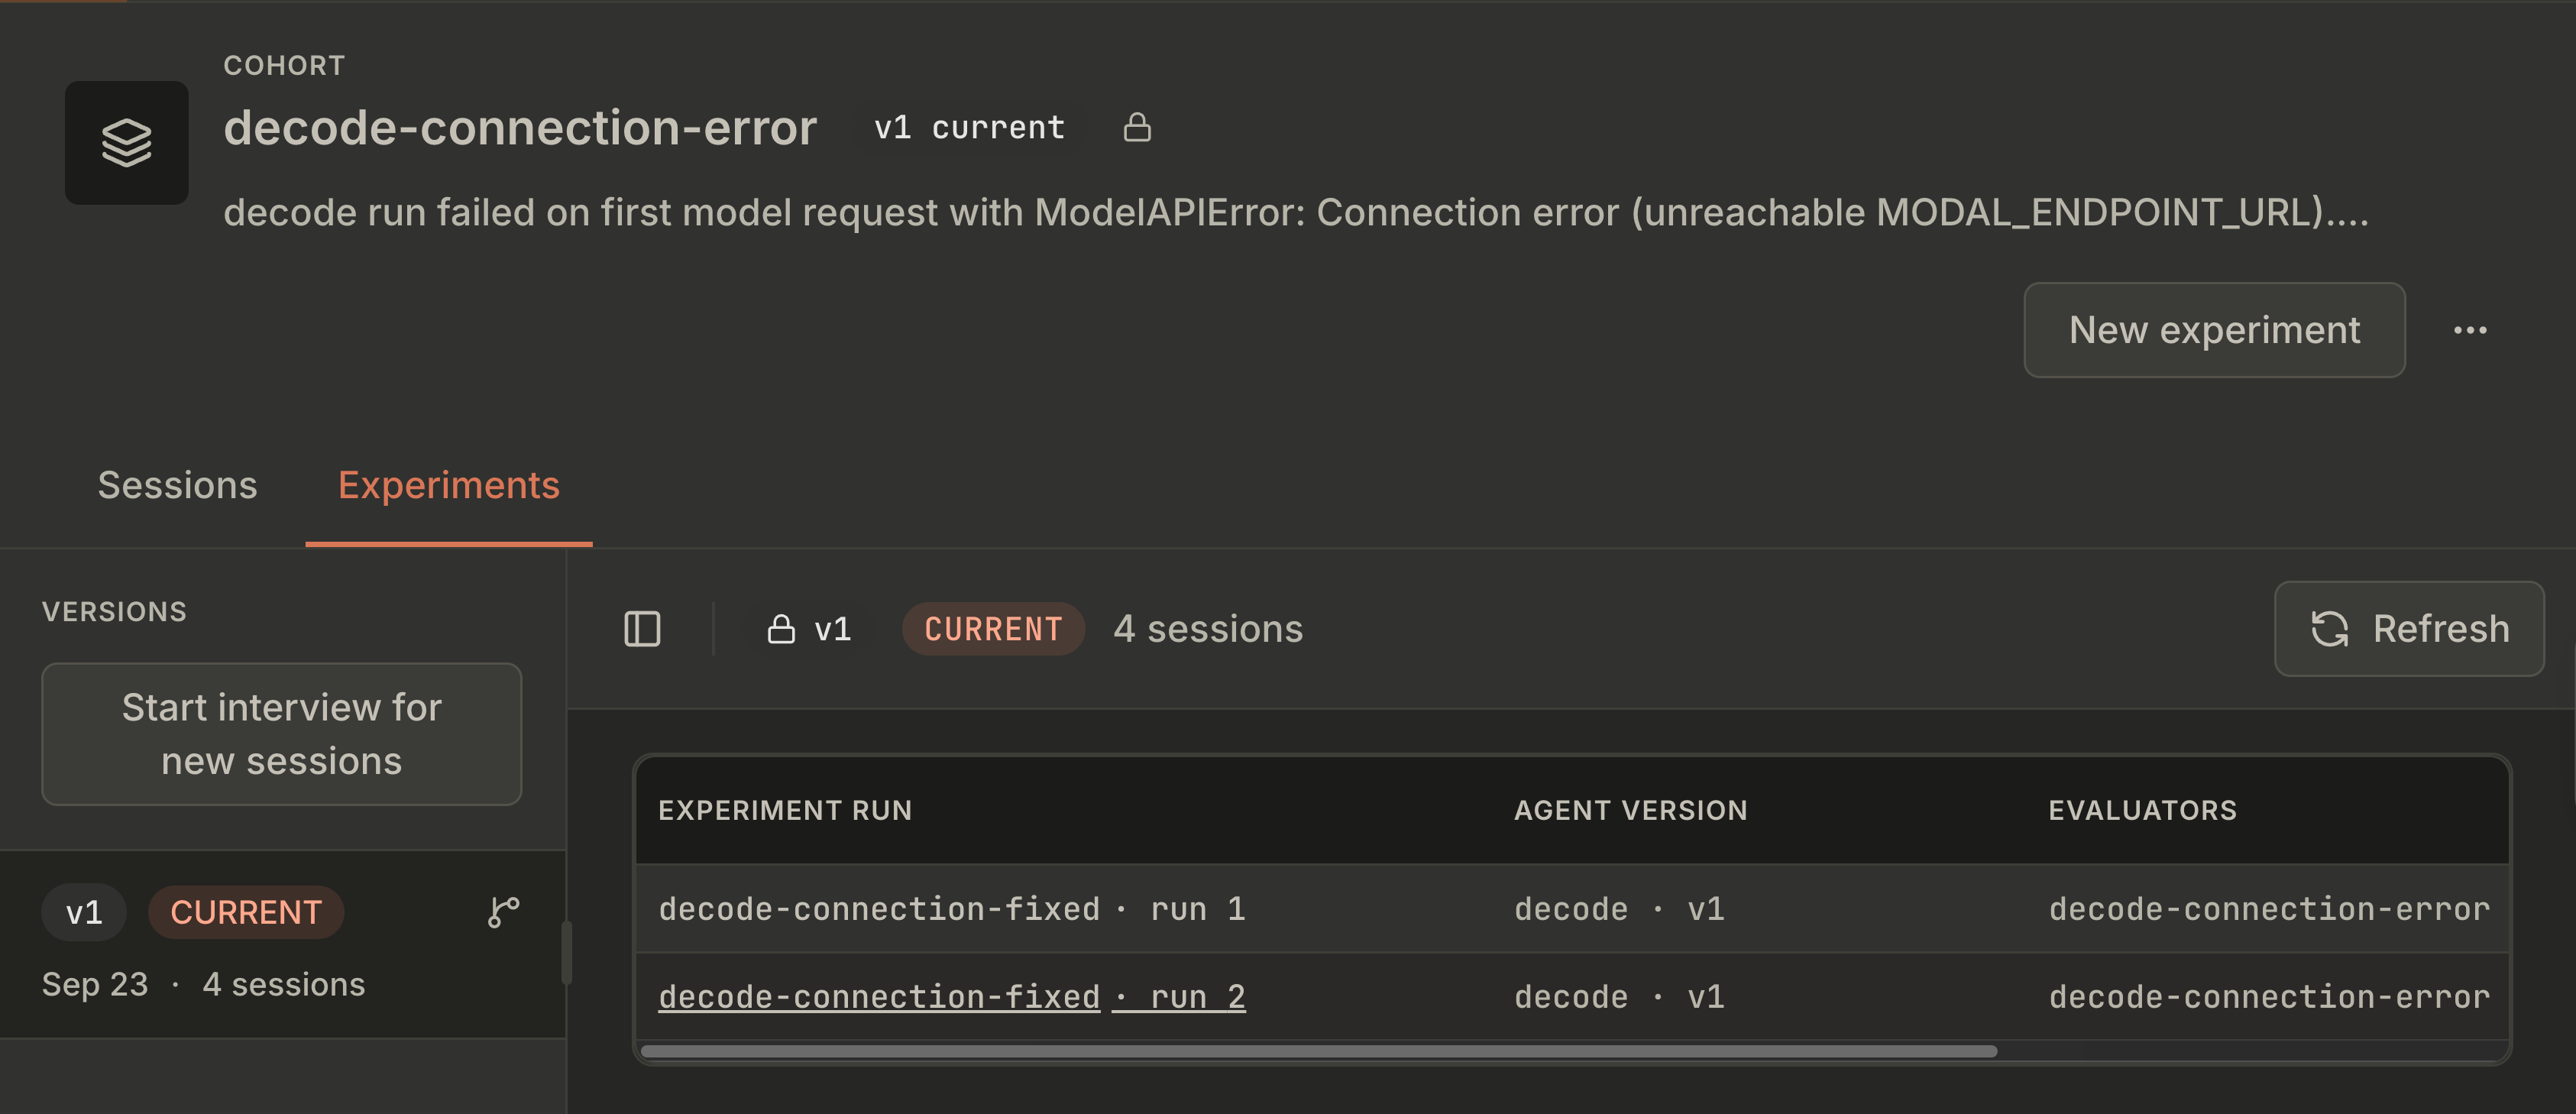
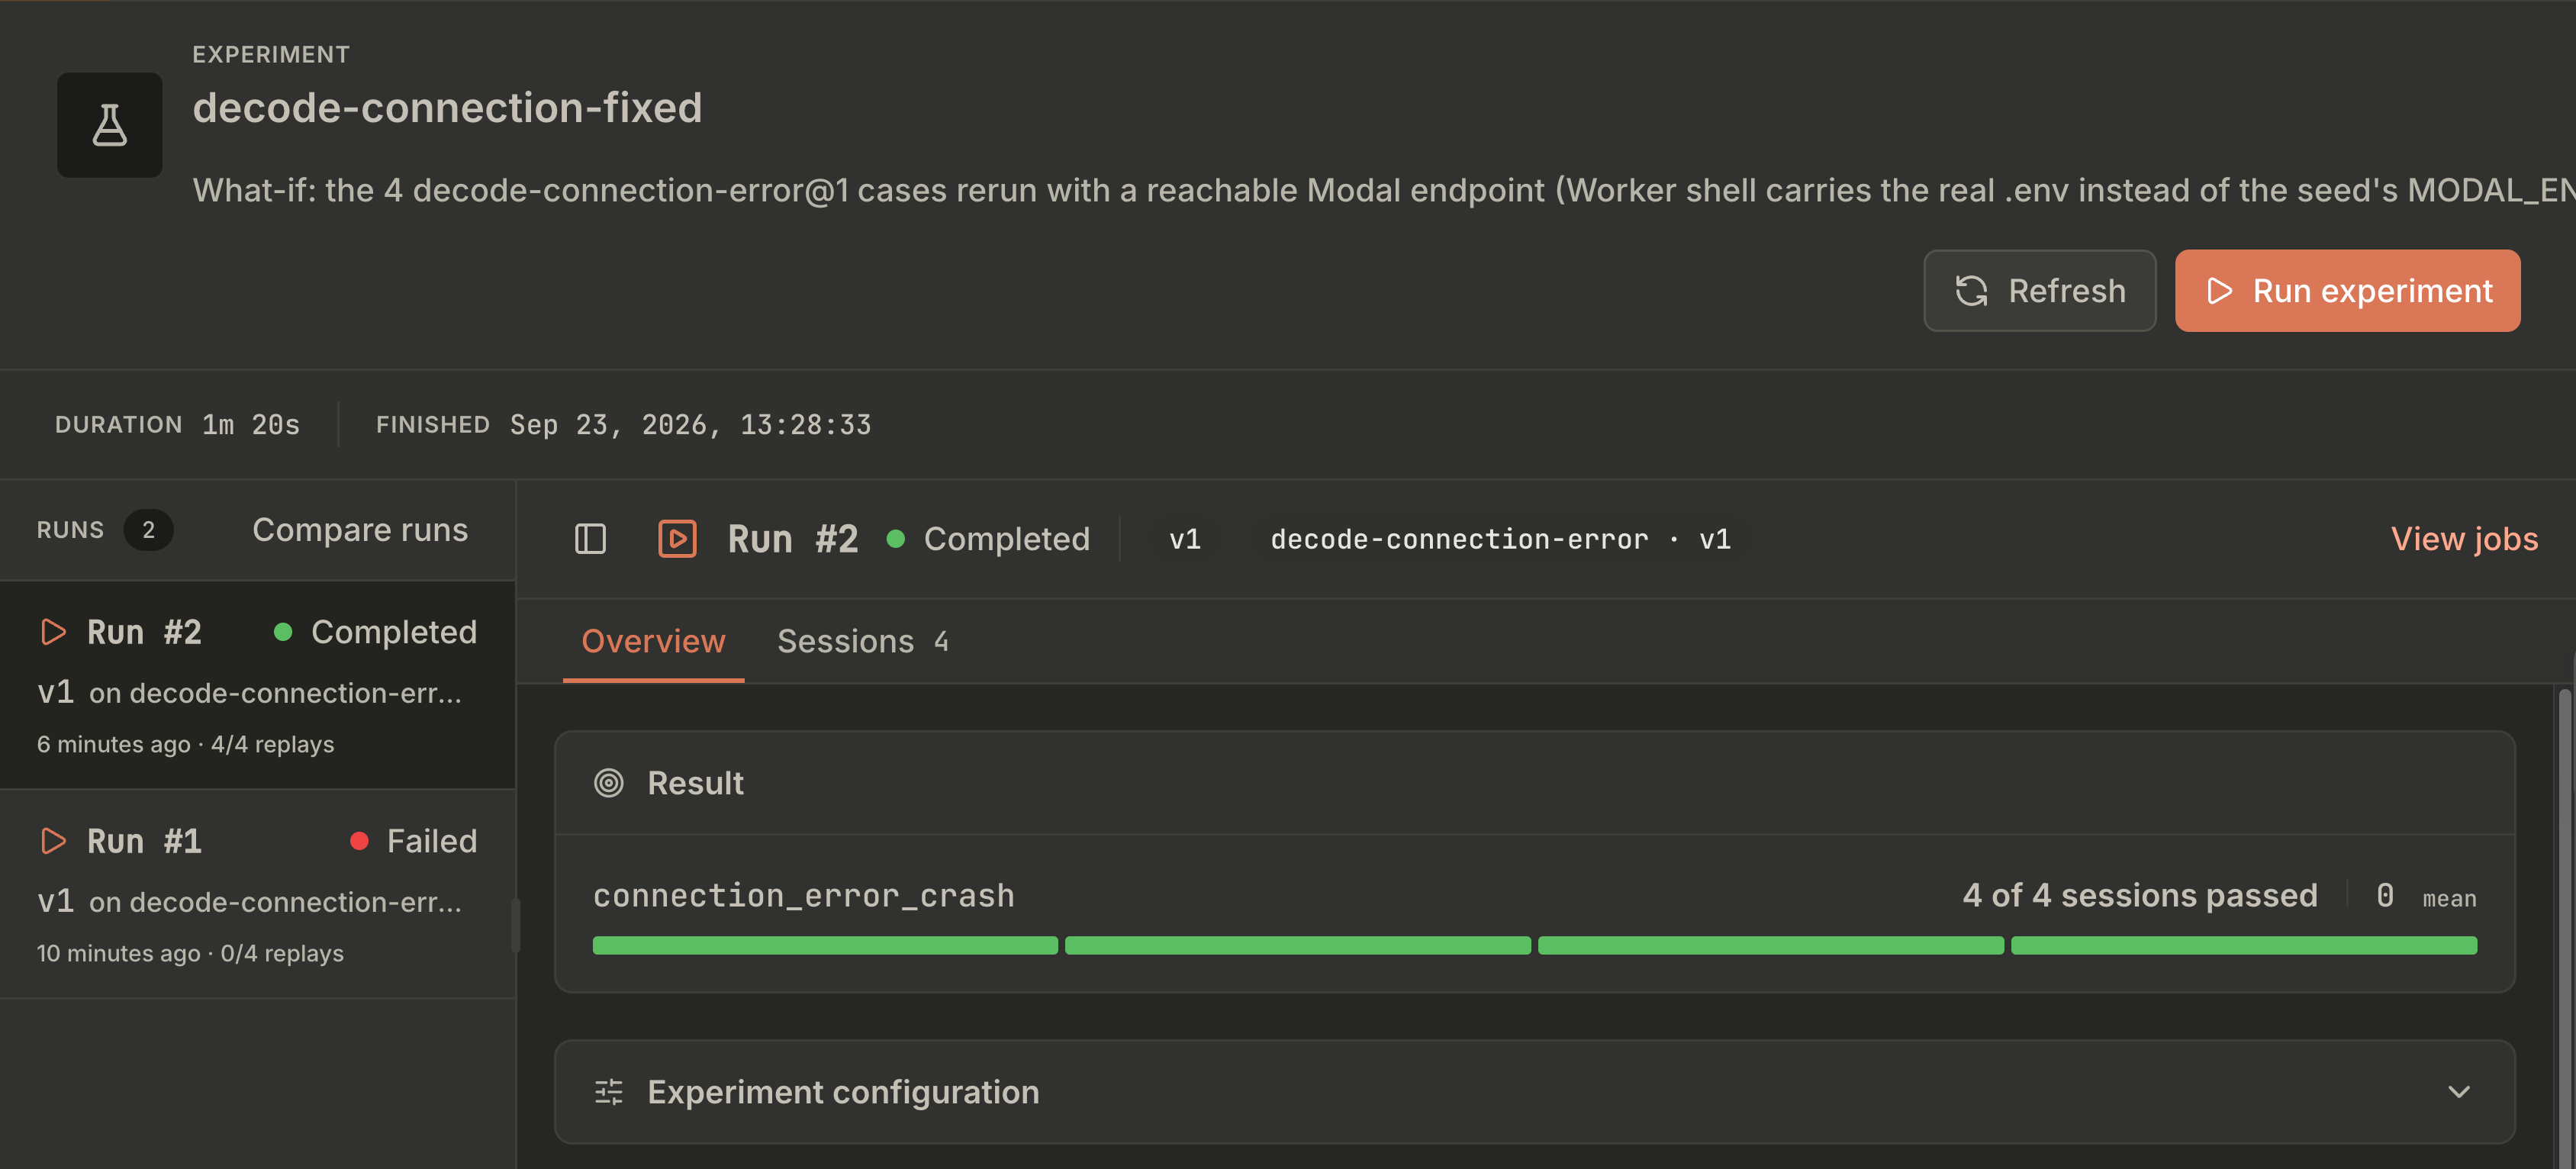
Two runs: run 1 replays the cohort with the code untouched and still fails on every session, so the failure reproduces and the recording is trustworthy. Run 2, after the fix, shows the failure class resolved on every session.
Properly understanding replays
A replay re-runs Decode from scratch. The only exception is that all tool calls are recorded, which means that if an agent calls a tool with the same inputs, it will use a cached output.
This means the agent loop’s decision path reflects the latest code changes. To avoid recreating the same context used by the tools, we reuse cached tool outputs instead, making it 10x easier to run experiments in the same context than to reproduce the files or database state the agent had at that moment. In Kitaru’s terms, a replay is still a fresh execution, not a playback.
Replays are an amazing way to reproduce your bugs as well. Start from your observed session, reproduce it with 0 changes to the code, then create a fork, change your model, system prompt or other parts of the code and run a replay again. Then you can do a diff between the reproduction and the fork to see the impact of your change.
Remember that every replay, as it executes your agent, burns real tokens instead of mocking the calls, so a 4-session cohort is cheap to rerun on every change and a 200-session one is not. That’s why cohorts stay small, and ideally evaluators are code, not judges.
In reality, we have more control than always using the cached outputs. For each tool (bash, file writes, web fetches), the tool policy decides whether the call is answered from the recording, a fixed table, a real execution, or a model, and what happens on a miss. Without a suitable policy, “a replay can call a live tool and repeat its side effects”: with the default passthrough, a replayed refund_payment refunds the card again.
Tool policy configs:
type:
history(answer from the recording),static(a fixed table),passthrough(run the tool for real), orllm(let a model invent the result).on_miss: what happens when the recording has no answer:
fail(stop the replay),error_result(hand the model an error and continue), orpassthrough(run the tool for real).scope: which recordings
historymay answer from:baseline,cohort_version, oragent.
Pick on_miss (what a replay does when the recording has no answer for a tool call) by how complete the recording is. Complete baselines get history with on_miss: fail, so an unanswerable call stops the replay instead of inventing the rest. Cut-off or crashed baselines, like our 2 cohorts, need on_miss: passthrough.
The tool then runs live inside the worker’s workspace (the fresh clone a worker runs Decode in). That is safe for Decode only because its live tools are bash and file edits inside a throwaway container. For an agent whose tools touch real resources such as a payment card or a database, passthrough is extremely dangerous and needs to be carefully mocked.
A replay always starts from a single session and produces a new one, listed next to the original in the sessions tab with Replay as its origin:
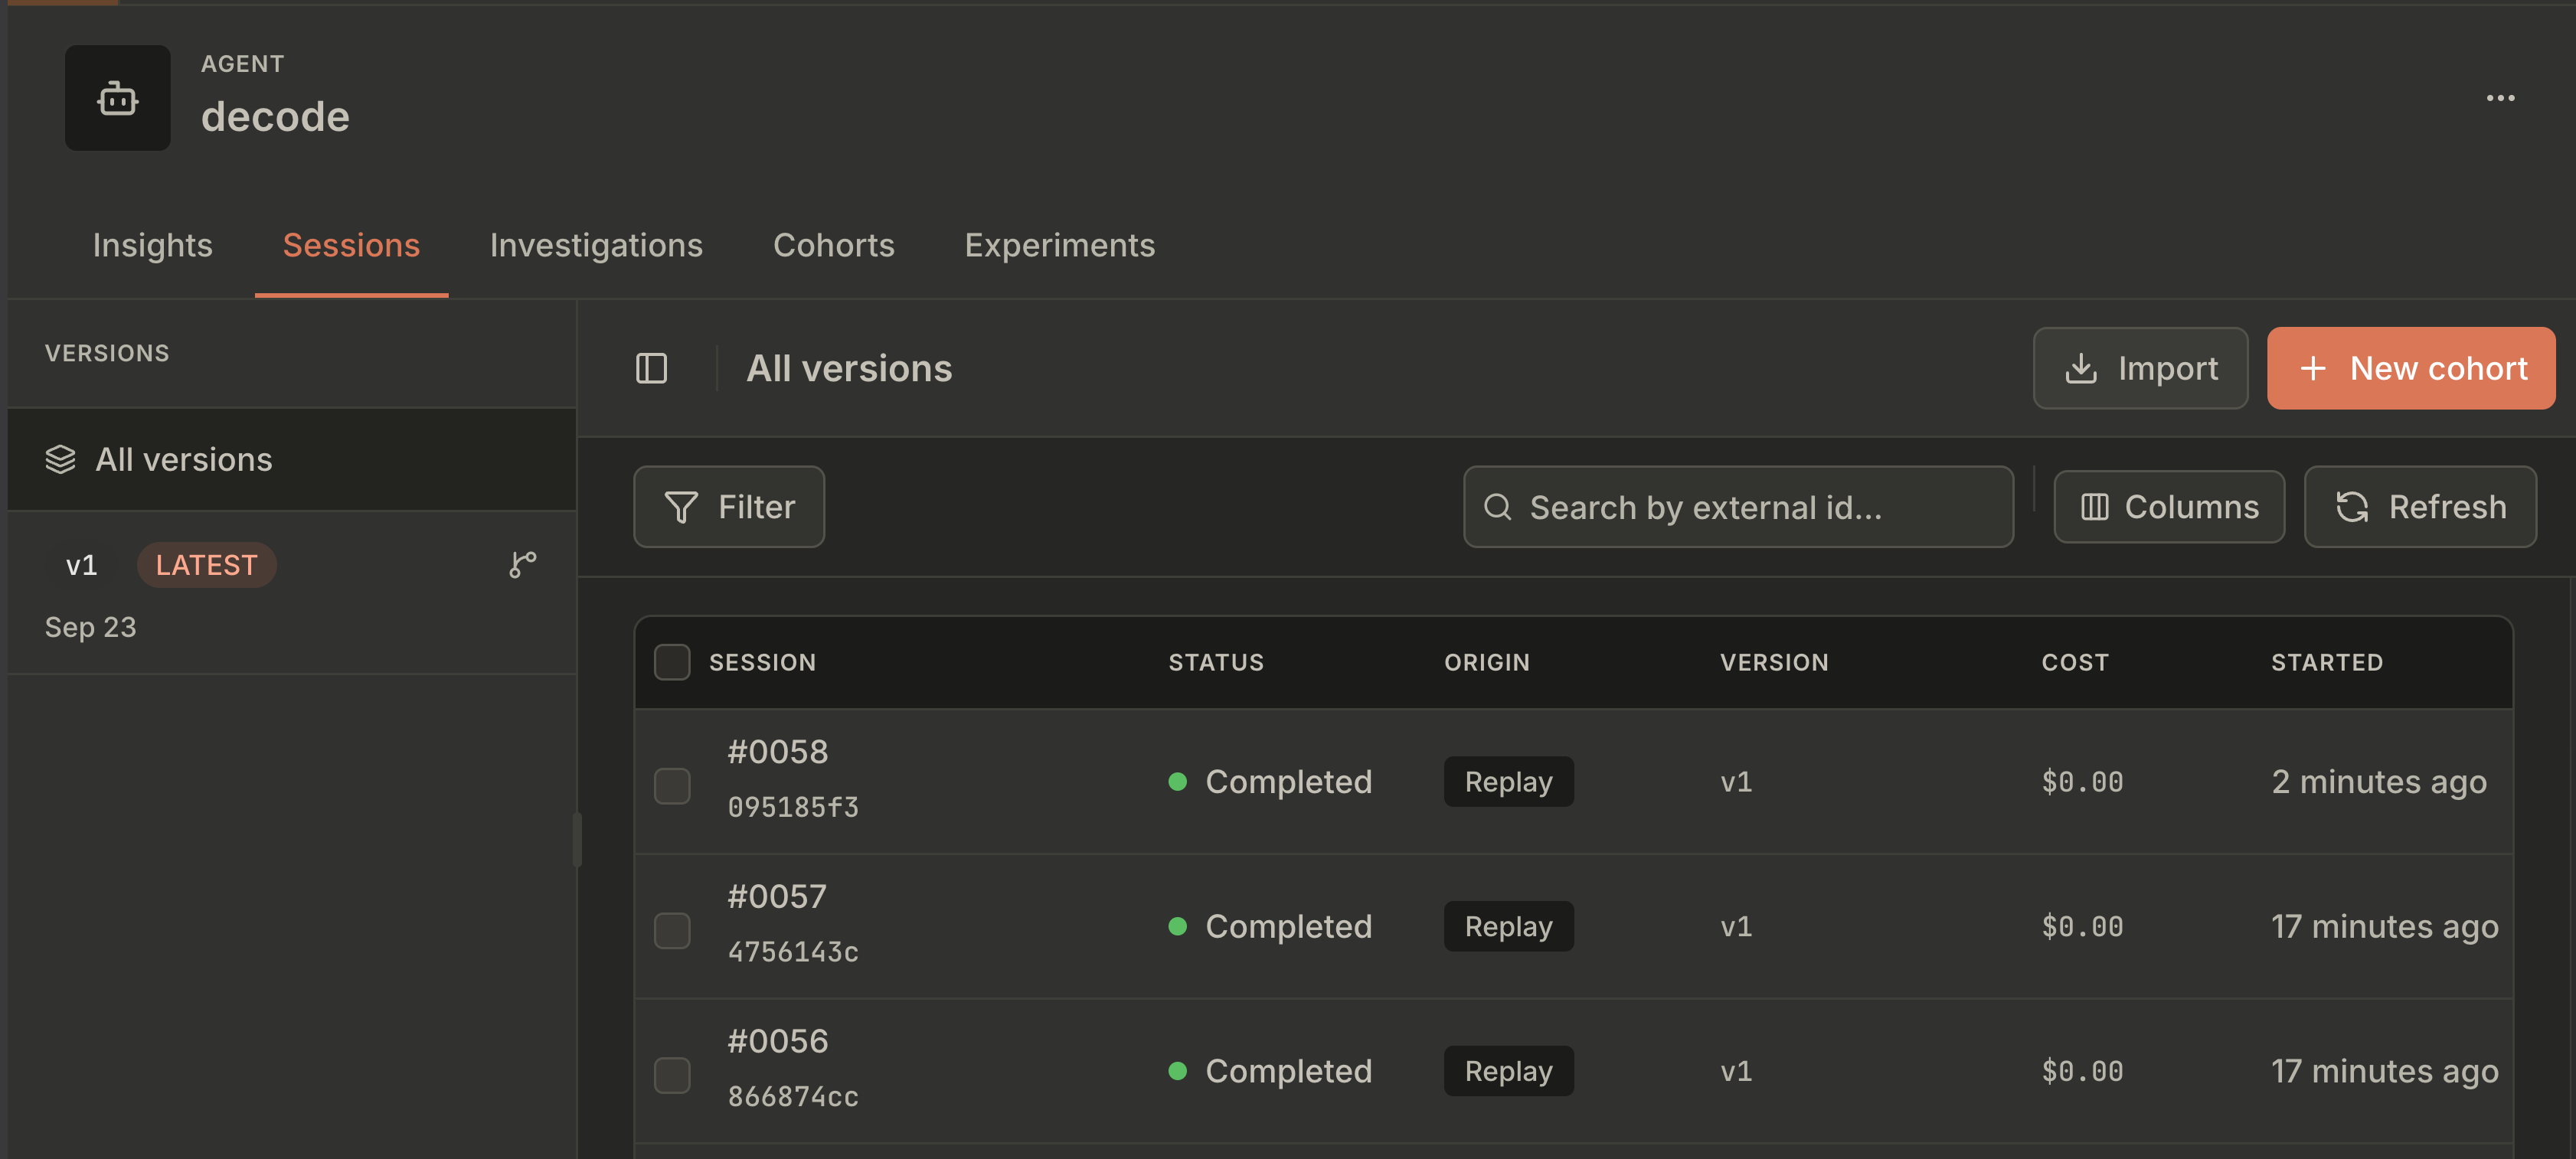
Select both, and the dashboard diffs the replay against its baseline, node by node:
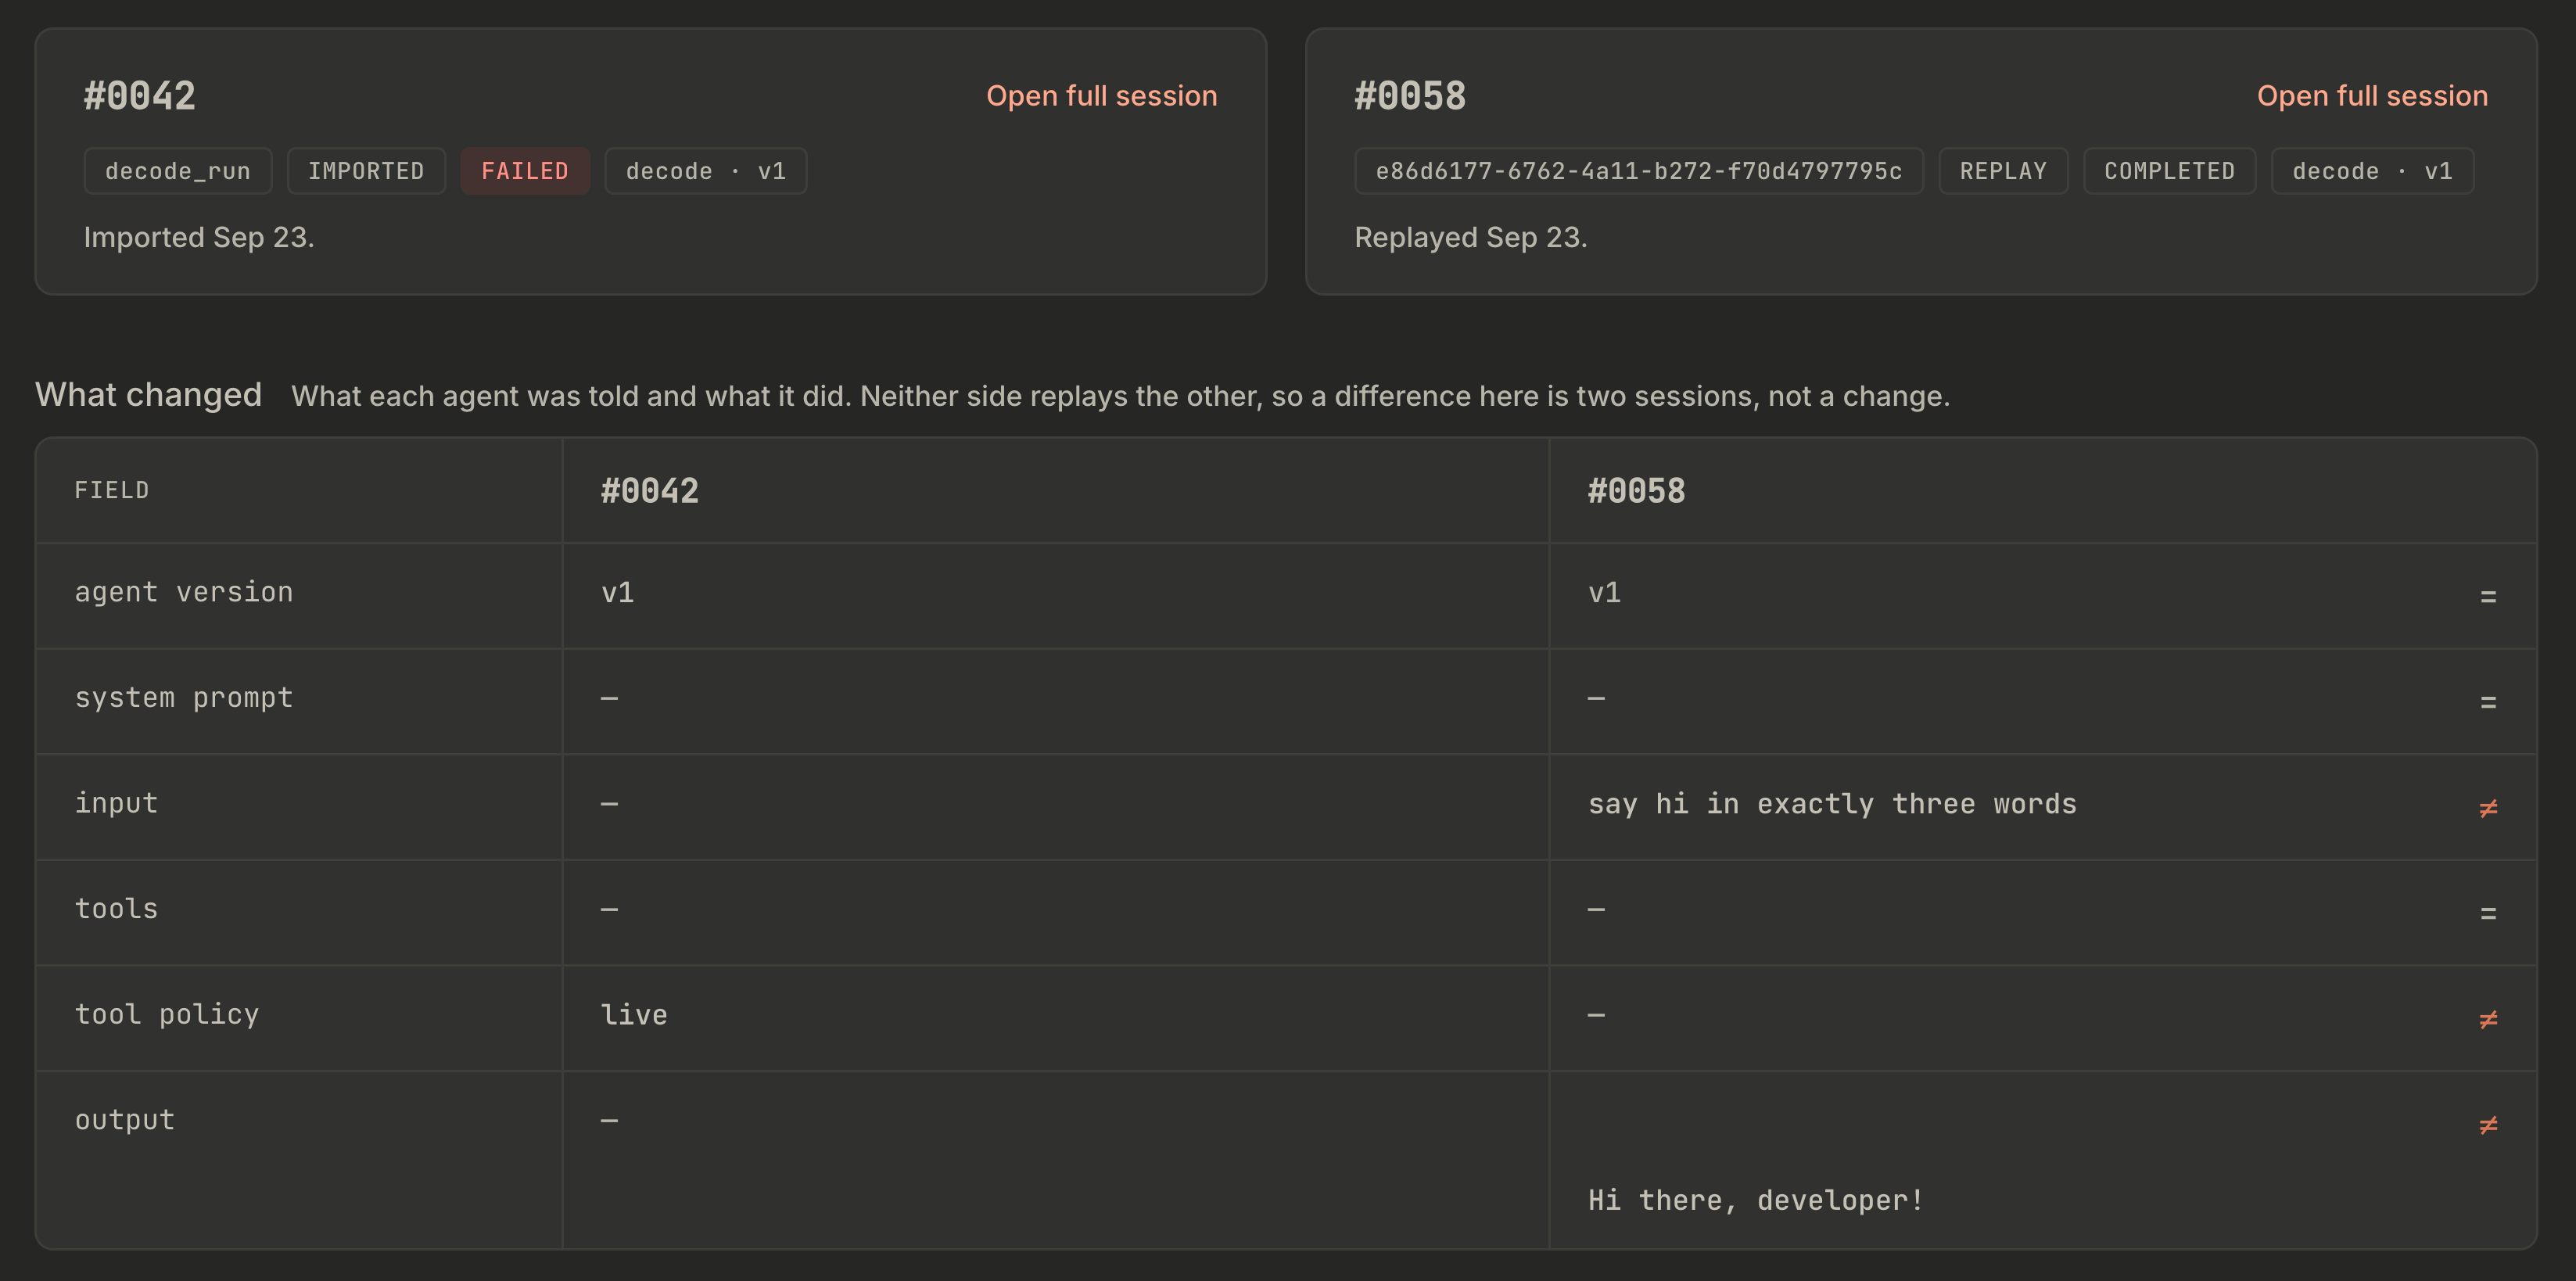
A replay with one change is exactly how you test a change to the harness. Let’s see how that works when swapping the model.
Swap the model, replay the same cohort
Suppose you change the harness and want to see how that change affects performance. Here the change is the model: from Qwen/Qwen3.6-35B-A3B-FP8 on Modal to gemini-3.8-flash.
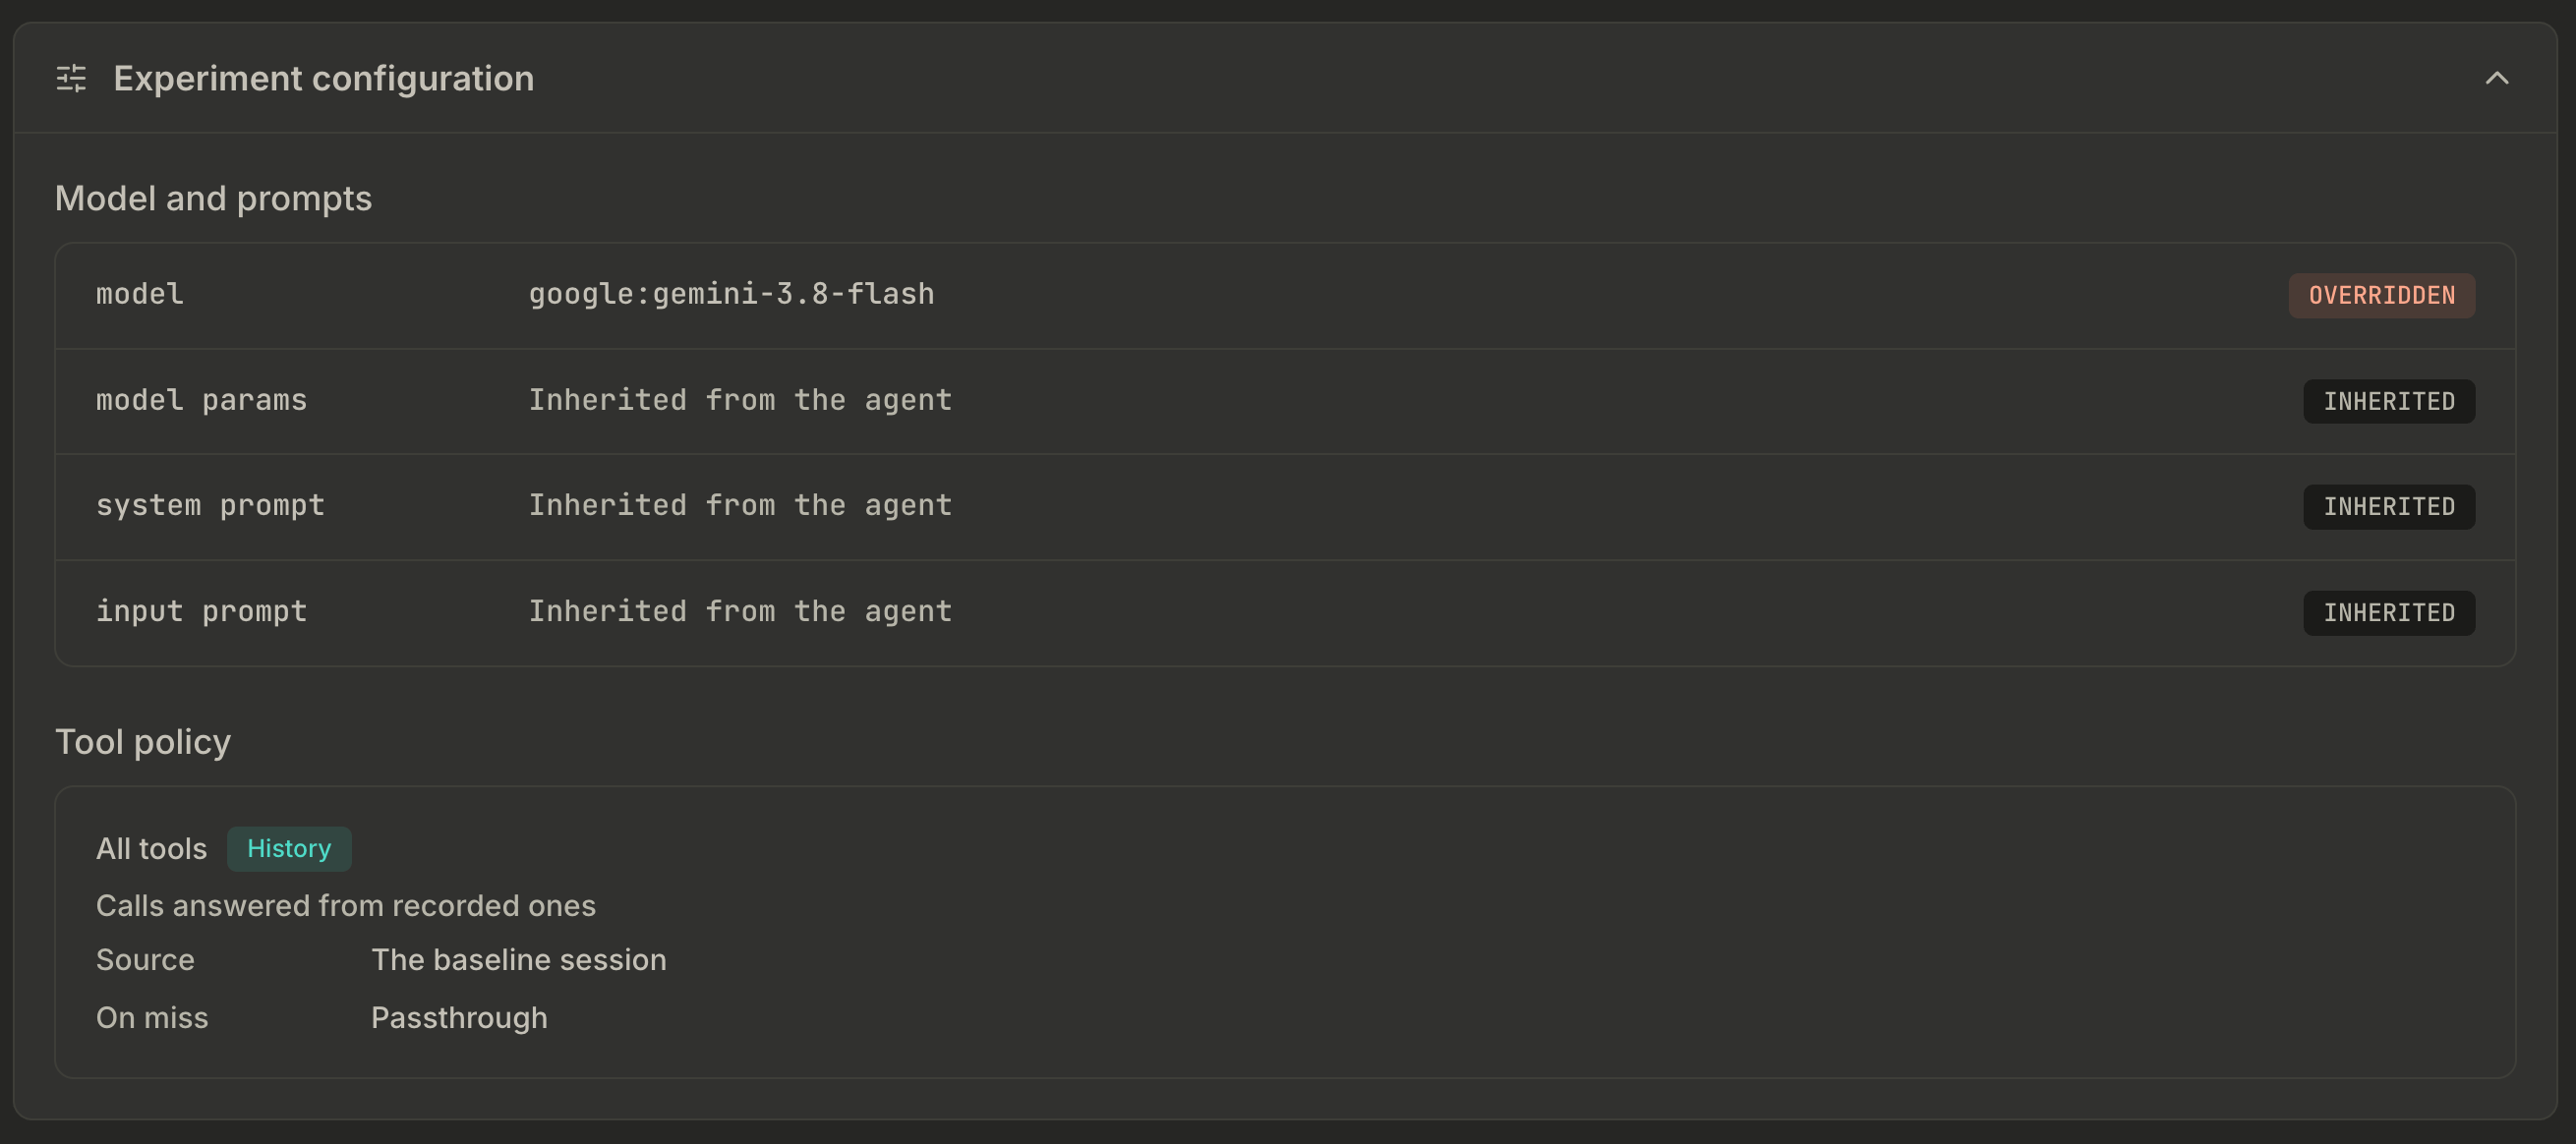
You create the experiment (nothing runs yet) with the following config: the decode-connection-error evaluator, a tool policy of history on the baseline with on_miss: passthrough, and a model override that replaces the model on every model call. The same experiment shape tests a prompt change through the system_prompt or prompt keys, or a parameter change through model_params.
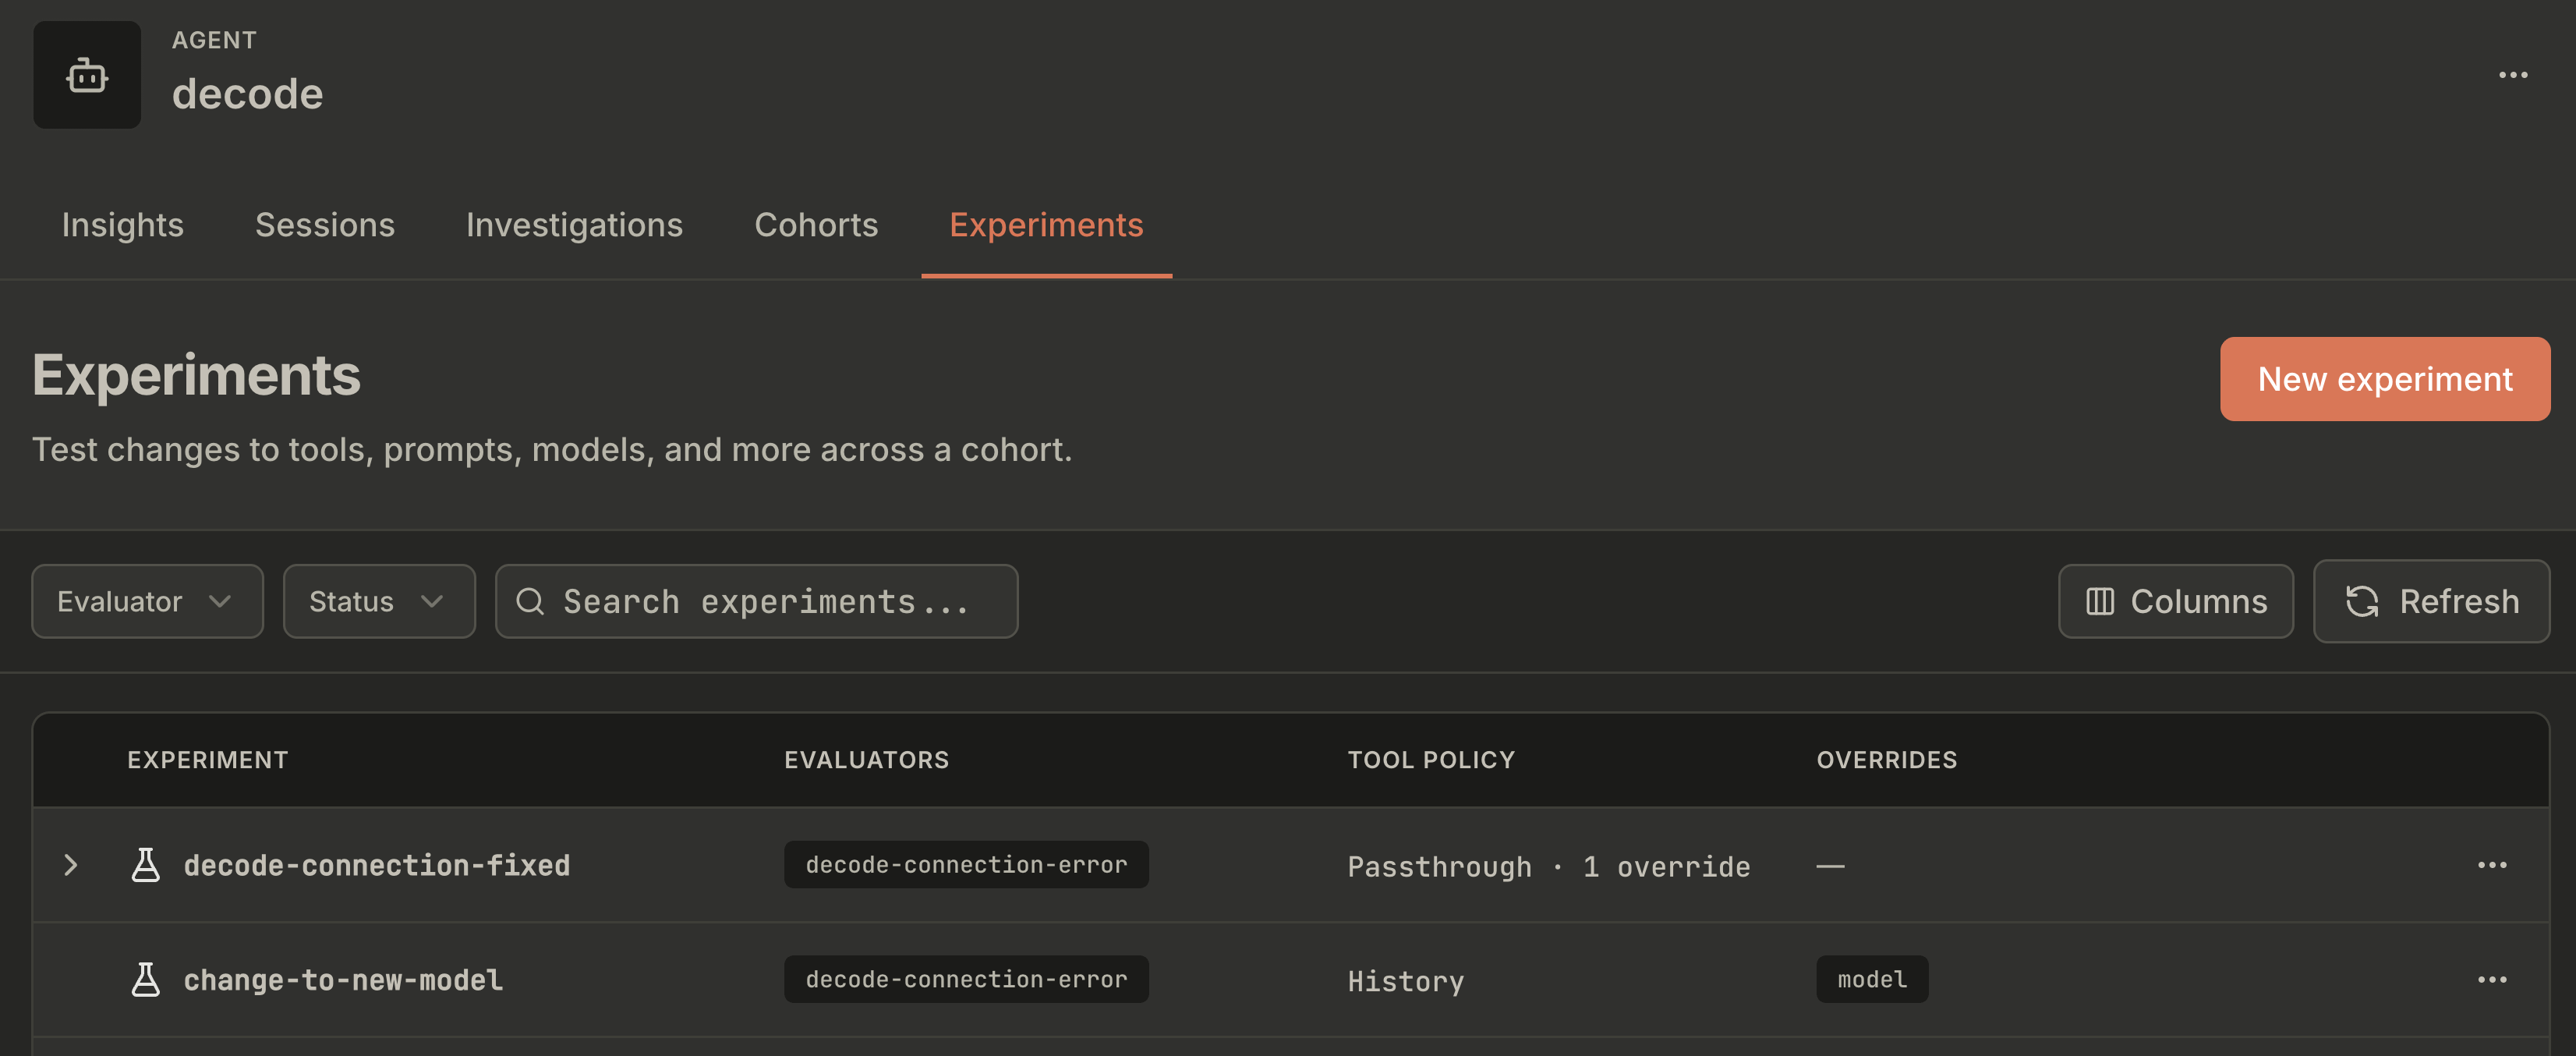
You start the run against the cohort version you replayed before (the frozen list of session ids the experiment ran against), and the worker replays each session on the new model.
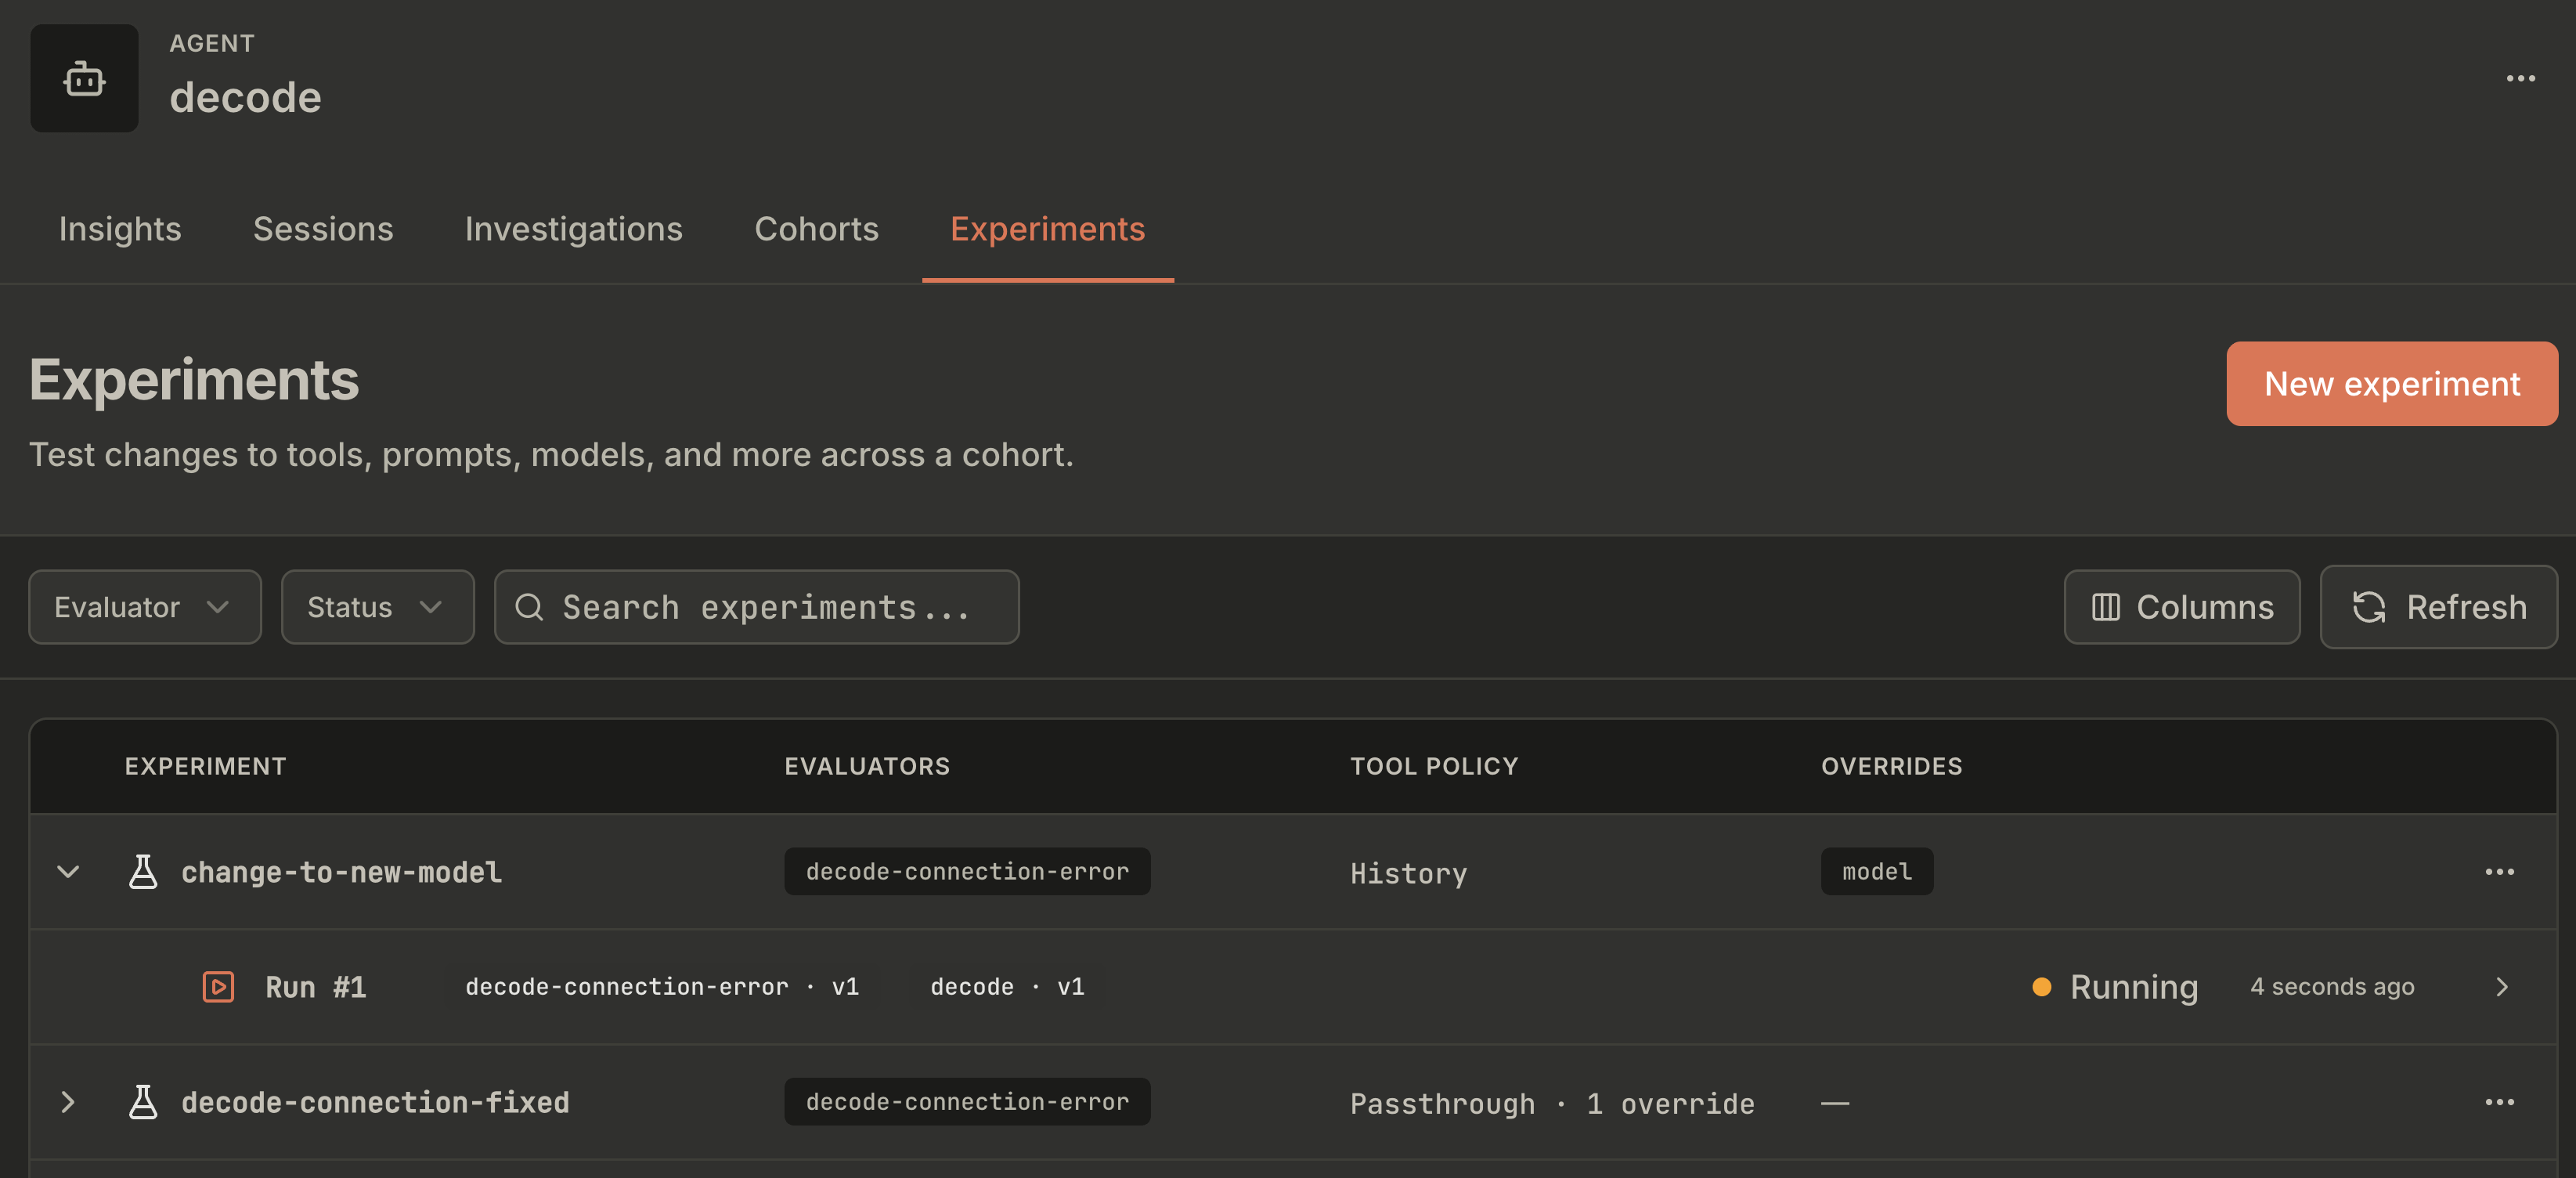
When it finishes, you read the pass/fail counts for that run. All 4 sessions passed:
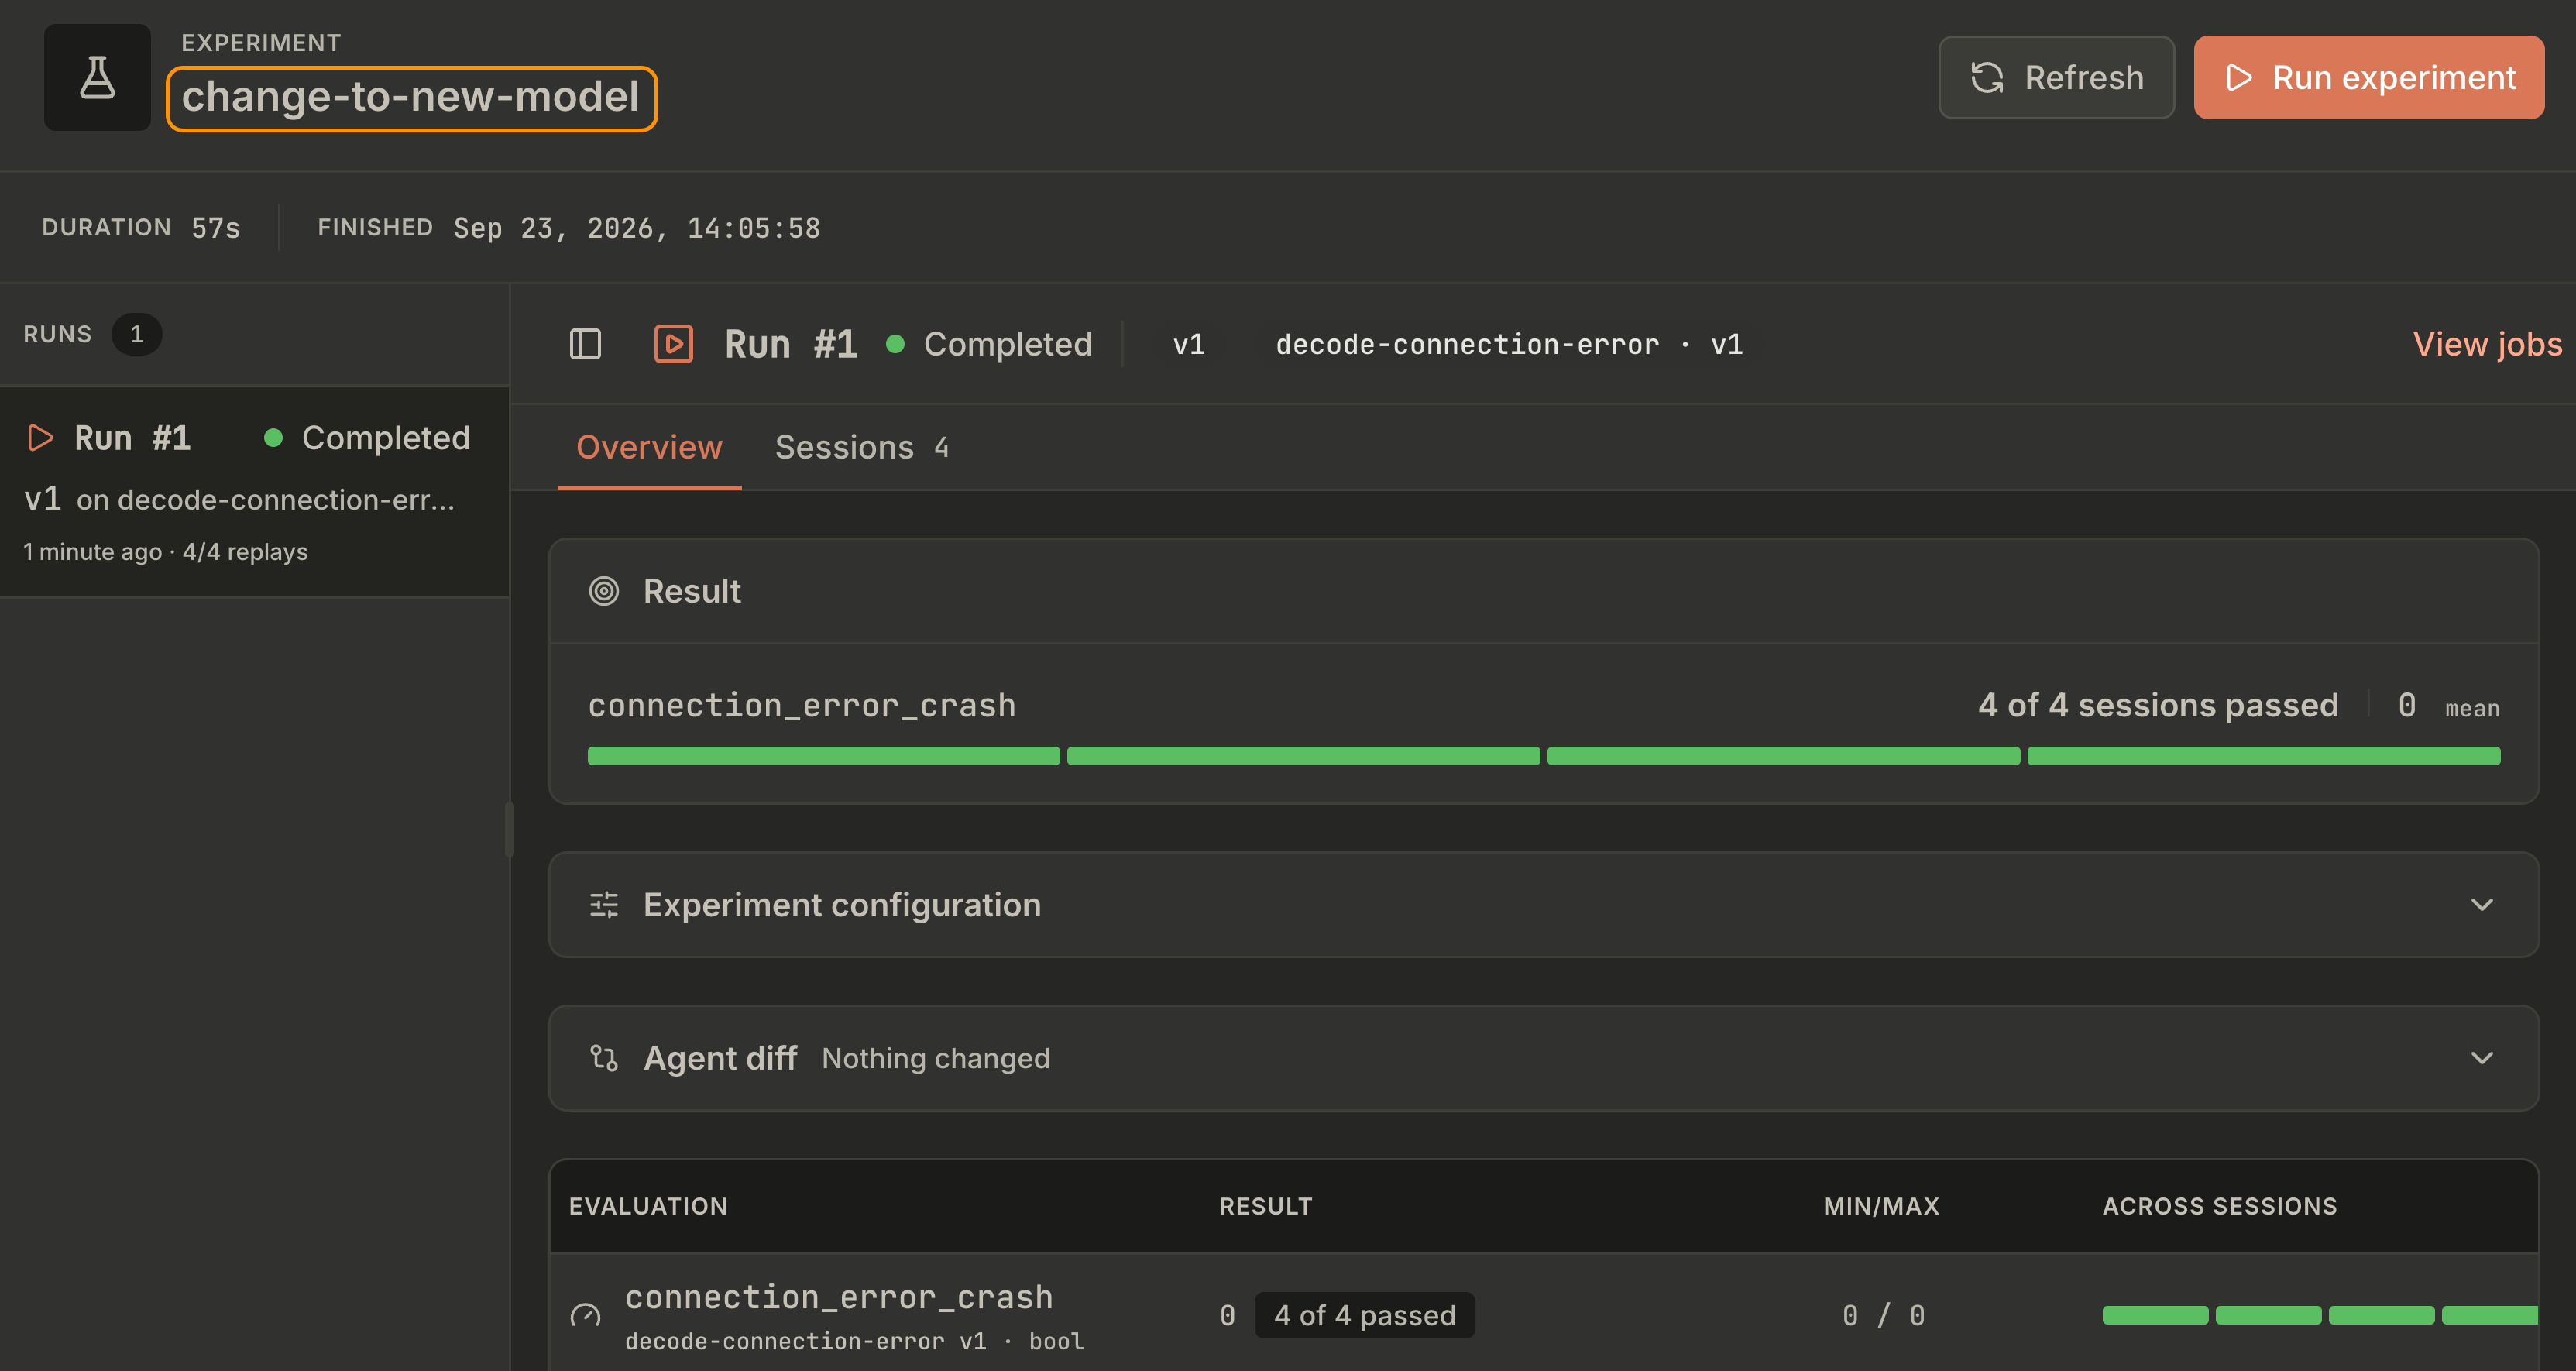
And the full experiment config sits next to them, with the model overridden and every tool answered from the recording:
⚠️
decode-connection-erroronly flags connection errors, so a replay that crashes for any other reason still passes it. A green run shows the new model did not reintroduce connection failures, not that the migration works. Pair it with an evaluator that checks the task itself, and read pass/fail per session plus the cost delta, never one aggregate score.
What replays do not solve
Replays are a good strategy for reproducing behavior and running regression tests, but not for running benchmarks that measure performance and optimize your system. In that case, run everything from scratch in isolated environments on open-ended tasks that ask whether the agent can complete its goal at all. See Lesson 7 to learn more about implementing your custom benchmark.
Replays also do not discover unseen scenarios. A regression suite only catches previous errors detected via the error analysis framework.
🧑💻 Clone the course repo, follow the replays runbook, seed 30 sessions, label 20, pick a cohort and build an evaluator for it.
With this lesson, we’ve finally wrapped up the How to Build a Coding Agent From Scratch course, where we’ve learned how to design, build and evaluate a Claude Code-style coding agent.
For previous lessons, here is the lesson-by-lesson course roadmap (see all on GitHub):
Turn Your Agent’s Failures Into a Regression Suite ← you are here
But here is what I’m wondering:
What is your current strategy to grow your regression tests?
Click the button below and tell me. I read every response.
Enjoyed the article? The most sincere compliment is to restack this for your readers.
Special thanks to Modal, Opik (by Comet), and Kitaru (by ZenML) for sponsoring this open-source course and keeping it free!

Whenever you’re ready, here is how I can help you
Go from agent user to agent builder. Master the foundations of AI agents and turn fragile demo code into reliable, production-ready systems with my course, Agent Engineering: Building Multi-Agent Systems (made with Towards AI).
35 lessons. Pure foundations from scratch. 4 mini-projects. 2 production systems. A certificate and direct access to me & industry experts in our Discord.
Built for software and data professionals transitioning into AI engineering. Rated 5/5 with 300+ students. The first 7 lessons are free:
Not ready to commit? Start with our free Agent AI Engineering Guide, a 6-day email course on the mistakes that silently break AI agents in production.
Images & videos
If not otherwise stated, all images and videos are created by the author.