

No Evals Dataset? Here's How to Build One from Scratch
Build evaluators to signal problems that users actually care about. Step-by-step guide.

Welcome to the AI Evals & Observability series: A 7-part journey from shipping AI apps to systematically improving them. Made by busy people. For busy people.
🧐 Everyone says you need AI evals. Few explain how to actually build them and answer questions such as…
How do we avoid creating evals that waste our time and resources? How do we build datasets and design evaluators that matter? How do we adapt them for RAG? ...and most importantly, how do we stop “vibe checking” and leverage evals to actually track and optimize our app?
This 7-article series breaks it all down from first principles:
Build an AI Evals Dataset from Scratch ← You are here
By the end, you’ll know how to integrate AI evals that actually track and improve the performance of your AI product. No vibe checking required!
Let’s get started.
Build an AI Evals Dataset from Scratch
In the previous article, you learned where, when, why and what AI Evals are. You saw the three core scenarios (optimization, regression, production monitoring) and the tech stack. But knowing where to use evals is only half the battle. You still need the actual dataset and evaluators to run them. That is what the rest of the articles from the series are about. The “how”.
For example, after shipping Brown (the writer agent from our Agentic AI Engineer course capstone project), I've been actively using it to write articles and lessons (even this one, haha), thus generating a lot of “production” traces. However, I had no structured way to evaluate them. I would look at a few outputs, tweak a prompt, and hope for the best. It wasn’t until I sat down, pulled 50 traces, and started writing notes on what went wrong with each one that I realized most of my failures fell into just 3–4 categories. That simple exercise of looking at the data changed everything. It told me exactly what to measure and what to fix first.
In reality, is not that simple, but not far from it. That’s what I want to teach you in this article.
Instead, most teams skip straight to building fancy evaluation dashboards or crafting elaborate scoring criteria without ever looking at their data. As Hamel Husain puts it: “Many teams make the mistake of crafting elaborate eval criteria without first looking at the data” [2]. This leads to two common traps: creating irrelevant criteria that waste resources on low-probability defects, or setting unrealistic criteria that the technology isn’t ready for.
You know you need AI evals, but you likely don’t have a dataset, you don’t have an evaluator, and you don’t know where to start. Building everything from scratch feels overwhelming. That is why many people start using generic tools and metrics, which is another huge mistake.
The solution is the error analysis framework. This is a step-by-step flywheel: start small, let the data guide you, and iteratively grow your dataset and evaluators. You do not need hundreds of examples or a perfect system on day one. You need 20–50 real traces and the discipline to look at them carefully, which you can easily start from day zero of your project.
In this article, we will cover:
How to create and format your initial dataset from production or synthetic traces.
How to manually label your data.
How to fix errors and grow your dataset with regression tests.
The iterative process of building and aligning an LLM judge.
How to perform systematic error analysis to cluster and prioritize fixes.
When to move from generic evaluators to specialized ones.
Before digging into the article, a quick word from our sponsor, Opik. ↓
Opik: Open-Source Observability for Your Multimodal AI Agents (Sponsored)
This AI Evals & Observability series is brought to you by Opik, the LLMOps open-source platform used by Uber, Netflix, Etsy, and more.
We’re proud to partner with a tool we actually use daily across our open-source courses and real-world AI products. Why? Because it makes evaluating multimodal AI apps as easy as evaluating text ones.

AI apps are no longer just text-in, text-out. They process images, generate videos, parse PDFs, and more. Monitoring and evaluating all of that used to be painful. With Opik, it’s not. Here is why we love it:
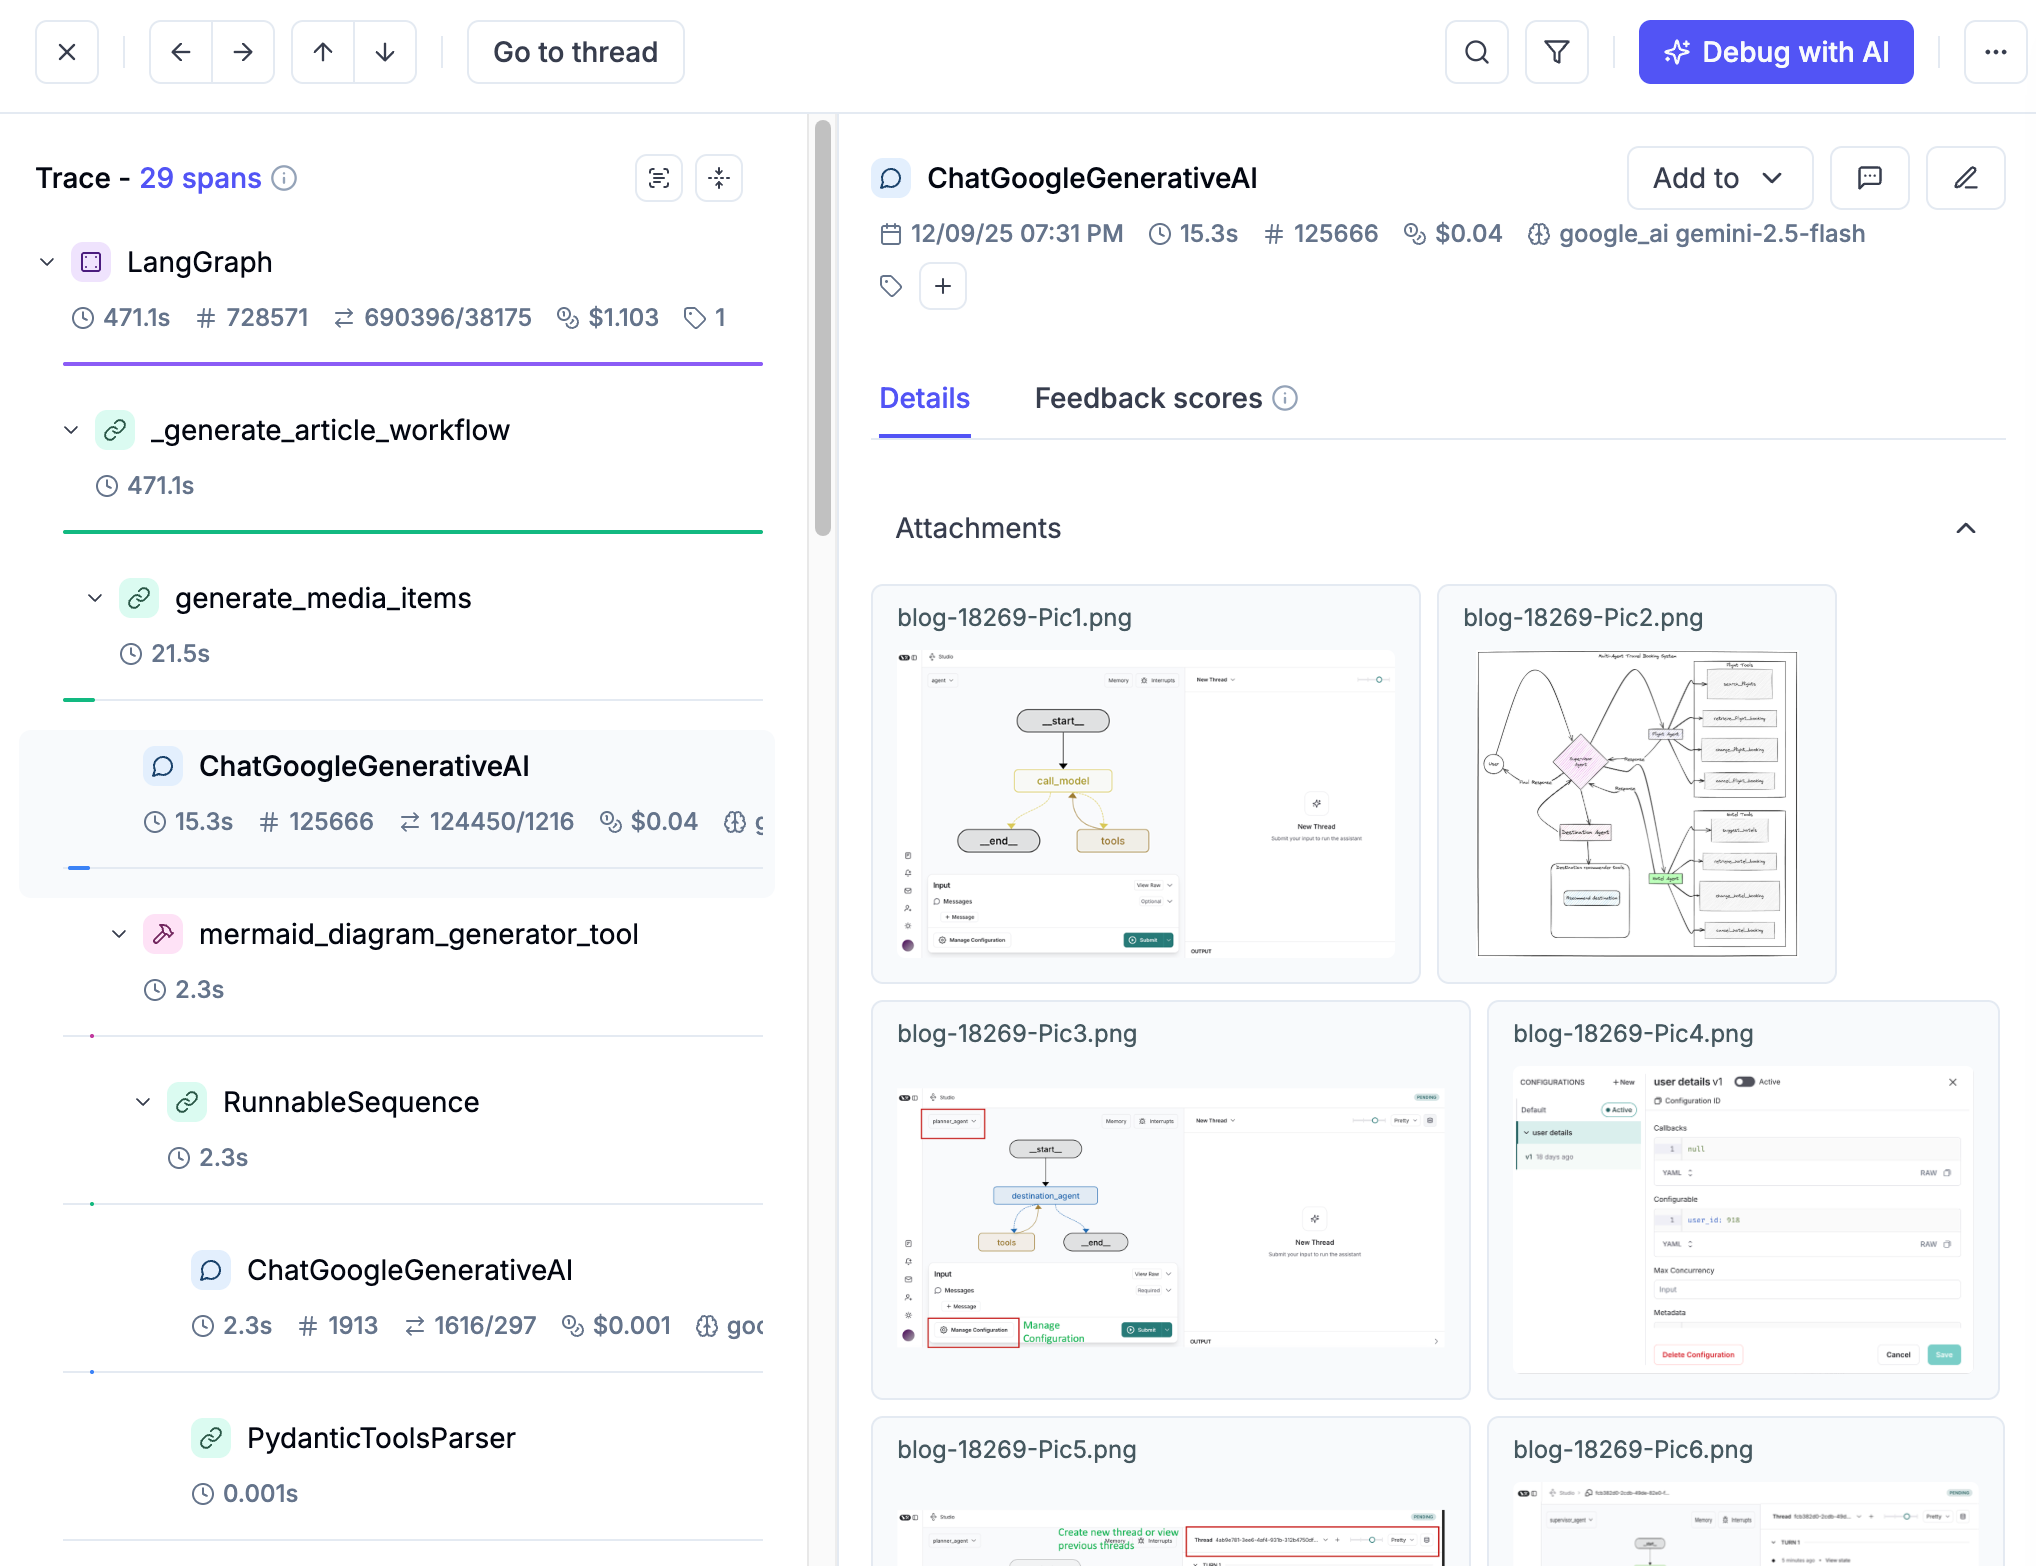
Trace everything — Opik renders images, videos and PDFs directly inside your traces. No more guessing what your model actually saw or generated. We use this daily, and it changed how we debug multimodal pipelines.
Zero-friction multimodal evals — Add image URLs or upload files directly in the UI, then run LLM-as-a-Judge evaluations on them. Opik auto-detects vision-capable models (GPT-4o, Claude 3+, Gemini) and warns you if the model doesn’t support vision.
Video generation? Traced automatically — Wrap your OpenAI client in one line, and Opik tracks the full Sora workflow: creation, polling, download, and logs the generated video as an attachment. Full visibility, minimal setup. Guide here.
Opik is fully open-source and works with custom code or most AI frameworks. You can also use the managed version for free (with 25K spans/month on their generous free tier). Learn more about evaluating multimodal traces:
↓ Now, let’s move back to the article.
Create the AI Evals Dataset
Before you can evaluate anything, you need a evals dataset. This is a collection of examples that represent how your app should behave. This is the foundation on which everything else builds. Start small, as 20–50 examples are enough, and grow it over time. As Anthropic recommends: “20-50 simple tasks drawn from real failures are a great start” [3].
The highest-value source for your evals dataset is real production traces. These are actual user interactions with your app. These reflect genuine usage patterns, edge cases, and failure modes that you could never fully anticipate upfront.
If you are pre-launch or have limited production data, start with the manual checks you already run during development. These are the behaviors you verify before each release, and common tasks end users try.

You must log everything: user input, system prompt, model output, tool calls, retrieved documents, and metadata such as channel, timestamp, and user ID. Make it easy to browse, filter, and search these traces. You can easily log these traces using observability/LLMOps tools such as Opik (which we always use) [4].
Aim for 50–100 traces initially. In early development, each change has a noticeable impact, so small sample sizes work fine. More mature systems need larger datasets.
In case you already have tons of production traces, you need to properly sample them.
More advanced sampling strategies include outlier detection (sorting by response length, latency, or tool calls and reviewing extremes), user feedback signals (prioritizing traces with negative feedback or escalations), metric-based sorting (using generic metrics as exploration signals), stratified sampling (grouping by user type, feature, or query category and sampling from each), and embedding clustering (generating embeddings of queries, clustering them to reveal natural groupings, then oversampling small clusters for edge cases).
If you don’t have enough production data, you can automatically create test examples using an LLM to generate synthetic user inputs across different dimensions like features, scenarios, and user personas. We will explore synthetic data generation in detail in Article 3.
Every example in your dataset should have a consistent structure:
Input: The user query or request.
Output: The final output of the agent.
Context: Any additional information the system had access to, such as retrieved documents, conversation history, or system prompts.
Trace Spans: The intermediate steps, such as tool calls (API calls, search operations), model calls or any other relevant step (e.g., mapping to Pydantic).
This structure ensures your evaluators have everything they need to judge whether the system performed correctly. It also makes your dataset portable across different evaluator types, from simple ones that just check whether a specific tool was called to more complex LLM Judges.
🔎 Suppose you are building a vertical assistant agent that drafts replies to work emails and Slack messages. You have been using it in production for two weeks and have logged traces. Here is how one formatted dataset entry looks like:
Input: A Slack message in #product from your Product Manager: “@you Can you estimate how long it would take to add CSV export to the reports page?”
Output: The agent’s generated reply: “Based on the current codebase, I’d estimate 3–5 days, including testing. The data layer is already structured for it — the main work would be the export logic and UI. Want me to write up a quick ticket with more detail?”
Context: The system prompt instructs the agent to match workplace communication norms, the user’s role (engineer), the channel (#product), and relevant prior messages in the thread.
Trace Spans: (1) A model call to classify the message type and urgency, (2) a retrieval step pulling relevant codebase context about the reports page, (3) a model call generating the draft reply.
You pull 50 such traces. These include a mix of emails and Slack messages across scenarios such as executive requests, colleague questions, and phishing attempts. You format each one this way.
Now that you have a dataset, the next step is to label it. You need to decide, for each example, whether the output is good enough.
Manually Label Your Dataset
To judge whether each example is “good” or “bad,” you need to appoint one or multiple domain experts. To avoid inconsistencies. The less, the better. The domain expert should be someone who genuinely understands your use case to lead the labeling process.
This step is key! Why? Because this person’s judgment becomes the definitive source of truth. In other words, how it labels your dataset will have a cascading effect on everything else.
For each example in your dataset, the domain expert makes a binary judgment: Pass or Fail. Do not use a 1–5 scale or letter grades. Just pass or fail.

Binary decisions force clarity. A score of “3.2 out of 5” is hard to interpret and even harder to act on [6]. Pass/fail forces you to articulate exactly what “good enough” means and creates actionable insights. If something fails, you know it needs fixing. If it passes, you move on.
For every judgment, especially failures, the domain expert must write a short critique explaining why it failed or passed. These critiques are gold. They capture the expert’s reasoning, surface patterns in what goes wrong, and later become a central piece in the few-shot examples you feed to your LLM judge.
Even if your labels are binary, using critiques adds detail, and instead of vague numbers like 3.4/5, a clear explanation highlights exactly what went well or what went wrong. Also, they indirectly act as instructions to your LLM judge. Reason why they are so important when adding them as few-shot examples.
Do not try to catch every single mistake in a trace. Find the first thing that went wrong, the most upstream error, and move to the next example. The goal is to surface recurring failure patterns, not to write a detailed report for each trace. However, do not be too concise. Each critique should be detailed enough to later serve as a few-shot example for your LLM judge.
With Opik’s API or MCP Server, you can easily extract traces into a spreadsheet, a simple internal tool, or your custom annotation tool, as discussed in Article 1, to do this. Display the input, the system’s output, and all the context side by side. Make labeling as frictionless as possible.
🔎 Consider our email/Slack assistant example. Your domain expert sits down with the first 50 traces and labels each one:
Trace #5 — FAIL: A vendor sent four specific technical questions about API integration. The agent replied: “I’ll look into these and get back to you.” Critique: “Failed to answer any of the four specific questions. Gave no timeline for follow-up. A vendor expecting technical answers got a vague brush-off. This damages the partnership.”
Trace #7 — PASS: The CFO approved a $50K budget reallocation and asked the user to loop in HR. The agent replied by restating the action items, confirming it would initiate the transfer and loop in HR, and promising a confirmation. Critique: “Accurately restates all action items from the CFO’s approval, commits to the next steps, and matches the professional tone expected for executive communication.”
Trace #6 — FAIL: An obvious advance-fee scam email from “Prince Makumba” offering $8.5M. The agent replied: “Could you provide more details about this inheritance?” Critique: “Engaged with a textbook scam email instead of ignoring it. Any reply validates the scammer’s target. Expected behavior: no reply.”
You now have a labeled dataset with pass/fail judgments and critiques. The natural next step: fix the obvious problems you’ve just discovered.
Manually Fix Errors
The labeling process will reveal generic, often simple issues. Examples include a missing instruction in a prompt, a broken tool call, or a formatting problem. Fix these before doing anything else. Do not build an evaluator for something you can just fix right now.
As Hamel Husain recommends, address obvious errors discovered during review before building judges. The point of the flywheel is product quality, not a pretty eval suite [4].
After fixing, re-run your system with the same inputs and potentially new ones to generate fresh outputs. Label the new outputs. Did your fixes work? Did they introduce new problems? This is the inner loop of the flywheel: create, label, fix, and repeat. Each iteration improves your system and enriches your dataset.
Every iteration adds more labeled examples to your dataset. Failed examples that you have now fixed become regression test cases. They ensure old bugs do not come back. New examples expand coverage. Over time, your dataset becomes a living artifact that captures the accumulated knowledge of what “good” and “bad” look like for your specific app. This is the foundation for everything that follows. Aim for continuous growth: start with 20–50, grow to 100+, and keep adding as you discover new failure modes in production.
🔎 Back to our simple agent example that answers professional emails or Slack messages. During labeling, the domain expert flagged several traces where the agent replied to obvious phishing and scam emails.
The fix was straightforward: add an explicit instruction to the system prompt telling the agent to never reply to messages from unrecognized external senders requesting money, credentials, or personal information. It should flag them as suspicious instead. After applying the fix, the expert re-runs the same scam inputs through the updated system. The agent now correctly produces no reply for all of them. These previously-failing traces become regression test cases. This ensures this class of errors never returns, even after future prompt changes.
At some point, manually labeling every example doesn’t scale. That’s when you need an automated evaluator to do the heavy lifting for you.
Iteratively Build Your Evaluator
You have been labeling by hand. That worked for the first 50–100 examples, but now you want to evaluate thousands of traces automatically. You need an evaluator. This is a system that can judge outputs without a human in the loop.
The key insight is to build it iteratively using the human-labeled data you have already collected, rather than designing evaluation criteria from scratch.

Before building your evaluator, split your labeled dataset into subsets:
Train: The examples you will use to build and tune your evaluator (e.g., as few-shot examples in your LLM judge prompt).
Dev: The examples you will use to check whether your evaluator is working while you iterate on it.
Test: The examples you set aside and never touch until you are ready for a final evaluation of your evaluator’s quality.
We will cover the details of how to split effectively and how to evaluate the evaluator’s effectiveness in Article 5. For now, the key idea is: do not train and test on the same data. Exactly how we do when training any other AI model.
Due to the nature of AI app outputs, which are non-deterministic, unstructured, and subjective, the most popular approach is to use an LLM to grade another LLM’s output. This is known as an “LLM judge” or “LLM-as-a-judge”.
At this stage, build one binary LLM judge that runs across your entire dataset. Think of it as a binary classifier: for each trace, it returns Pass (1) or Fail (0) plus a critique explaining its reasoning. Not a 1–5 scale. Not a letter grade. Just pass/fail with a written justification. This mirrors exactly what your domain expert did during manual labeling.
Binary judgments are clear, actionable, and easy to aggregate. A score of “3.2 out of 5” is hard to interpret and even harder to act on. Pass/fail forces clarity and creates actionable insights.
The real power lies in your few-shot examples and dataset, not your prompt. This is a counterintuitive but critical insight: the system prompt for your LLM judge can be almost neutral. Just specify what the task is, the expected output format (pass/fail + critique), and a few core steps. Keep it simple. The real guidance comes from the few-shot examples you include in the prompt. These are the labeled examples from your dataset with their critiques. These examples encode your domain expert’s judgment, show the LLM what “good” and “bad” look like for your specific use case, and steer the judge far more effectively than elaborate prompt instructions ever could. Your dataset is the secret weapon, not your system prompt. More on this in Article 4.
To build it, start with the critiques your domain expert wrote during manual labeling. Select representative pass and fail examples. These become the few-shot examples in your judge prompt. Test the judge against your dev set and iterate until it mostly agrees with your domain expert’s labels.
Not everything needs an LLM judge. For anything that can be checked with simple logic (true/false or numeric), use code-based checks. Examples include checking whether the response included a required disclaimer, whether it is within the word limit, whether it returned valid structured output, or whether it called the right tool.
Code-based evaluators are faster, cheaper, and more reliable than LLM judges for objective checks. Reserve LLM judges for subjective or nuanced checks. These include tone, helpfulness, conversational flow, or quality of handoffs, where correctness is hard to express in code. More on this in Article 4. For now, the rule of thumb is: use code when you can, use an LLM judge when you must.
Your evaluator is only useful if it agrees with your domain expert. Run the evaluator on the dev set and determine how often it agrees with the human. Create an agreement matrix comparing the human label to the evaluator’s label. If the evaluator says “Pass” when the human said “Fail” (or vice versa), refine the evaluator’s prompt or logic until the agreement is high enough to trust. Be aware that raw agreement can be misleading with imbalanced datasets. More on this in Article 5. For now, the key idea is: always validate your automated evaluator against human judgment before trusting it.
“Many teams make the mistake of crafting elaborate eval criteria without first looking at the data” [2]. This quote from Hamel Husain captures the core philosophy of the error analysis framework. Designing evaluation criteria in a vacuum. Without first reviewing your actual traces and failure modes, you risk creating irrelevant criteria that waste resources on low-probability defects or unrealistic criteria. The solution is to put the data and metrics first, not preset criteria or LLMs. Let the failure modes you discover through manual review and error analysis drive what you evaluate.
🔎 Back to our example. Let’s assume you select 15 labeled traces with their critiques from your dataset and use them as few-shot examples in your LLM judge prompt. For instance, you include the vendor email trace (Fail — “didn’t answer any of the four specific questions, gave no timeline”) and the CFO budget trace (Pass — “accurately restates action items, commits to next steps, matches professional tone”).
The judge's prompt simply says: “You are evaluating whether an AI email/Slack assistant produced an appropriate reply. For each trace, output Pass or Fail with a critique explaining your reasoning. Here are examples of how a domain expert judged similar traces:” followed by those few-shot examples. You run this judge on your dev set of 20 traces. It agrees with the domain expert’s labels on 18 out of 20. The two disagreements reveal that the judge is too lenient on vague responses to multi-part questions. You add another few-shot example covering that pattern, and agreement improves.
You now have automated evaluators aligned with human judgment. The next step is to run them on new data and analyze the errors they find.
Doing Error Analysis
Your evaluator is running. It is flagging failures across hundreds or thousands of traces. But a list of pass/fail results is not enough. You need to understand which errors are occurring, how often, and which to fix first. This is error analysis: the most important activity in evals. It is the systematic process of clustering, ranking, and acting on the failures your evaluators surface. It helps you decide what evaluators to create in the first place, allowing you to identify failure modes unique to your application and data.
Sample a fresh batch of production traces (or new synthetic data) from your observability layer, such as Opik, that your evaluator hasn’t seen before. Run your evaluator on these traces. You now have a set of Pass/Fail results with critiques.
This is where the flywheel connects to production monitoring: sample live traces regularly and run your evaluators on them to track quality over time.

If you have been writing critiques during manual labeling, you have already been practicing open coding. This section formalizes and scales that process using your automated evaluators’ output on new traces.
For each failed trace, write a short, informal note describing what went wrong. Do this in your own words, free-form. These are called “open codes” in qualitative research. Keep writing until patterns emerge. Examples include “hallucinated product feature,” “wrong tool call,” “missed escalation,” “bad formatting,” or “wrong tone.”
Once you have enough open codes, use an LLM to help group them into higher-level categories (axial codes). For example, individual notes about “ignored user’s refund request,” “didn’t acknowledge frustration,” and “transferred too late” might cluster into a category called “human handoff issues.” Review and edit these categories yourself. Make labels specific and actionable. Merge or split until they feel right. Add a “none of the above” category so the LLM can signal gaps and help you discover new patterns. Ultimately, identify the most frequent categories. This tells you where to focus.
Not all failure categories are equally important. Your overall pass rate can be misleading. As Jason Liu warns, aggregate metrics lie [7]. You need to look at each cluster individually.
Rank each error cluster using a 2×2 matrix with two dimensions:
Frequency (Volume): How often does this error occur?
Severity (Impact): How bad is this error when it does occur?
This gives you four quadrants:
High frequency + High severity: Your top priority. Fix these immediately. These are the errors that happen often and hurt the most.
High frequency + Low severity: Important to address, but less urgent. They are annoying but not critical.
Low frequency + High severity: Monitor closely. They don’t happen often, but when they do, the consequences are serious (e.g., safety issues, data leaks).
Low frequency + Low severity: Deprioritize. These can wait.
For a more nuanced prioritization, compute: Priority = Frequency × Severity × Business Value. A low-frequency error might jump to the top of the list if it directly impacts revenue or user safety. For example, a “hallucinated pricing” error might only happen 5% of the time, but its business impact is critical. This is far more important than a 30% “formatting” error that merely annoys users. Context matters: let business value break ties and override pure frequency counts.
This step also helps you surface problematic traces for review beyond user feedback. Your evaluators can proactively identify issues that users haven’t yet complained about. The goal is to turn vague impressions (“the app feels off”) into specific, ranked problems (“hallucination errors account for 25% of failures and have a critical business impact”).
For the highest-priority error categories, take action. Simple fixes might involve adjusting prompts, fixing tool configurations, or updating system instructions. Complex fixes might require redesigning the agent’s workflow, adding new tools, or restructuring the context. After fixing, add the previously failing traces to your dataset as regression test cases. Run your evaluators again to verify the fix worked and didn’t break anything else.
The first round of error analysis is a one-time investment of about 3–4 days. After the initial setup, 30 minutes per week is enough to review the latest failures and top categories, fix the easiest high-impact issues, and add or refine an evaluator only for stubborn, important problems. Re-run a full error analysis when you see a spike in failure rates, when user feedback reveals a new class of issues, or when your evaluators start feeling stale.
Over time, the flywheel converges. You fix the biggest problems first, your failure rates drop, and the remaining issues become smaller and less frequent. How often you need to run the flywheel depends on your online signals: are users satisfied, or are there anomalies?
🔎 Based on our example, let’s suppose you run your LLM judge on 200 new production traces from the email/Slack assistant. It flags 60 failures. You write open codes for each. These are quick notes like “replied to phishing link,” “mocked colleague’s achievement,” “leaked Annual Recurring Revenue (ARR) to external contact,” or “no reply to urgent CEO request.” Then you use an LLM to cluster these into axial codes:
Tone & Professionalism Issues (18 failures): hostile replies, dismissive responses, overly casual tone with executives.
Security Awareness Failures (14 failures): engaging with phishing, falling for CEO impersonation scams, clicking malicious links.
Information Leaks (10 failures): sharing confidential financials, disclosing unreleased product plans, revealing salary data to strangers.
Missing/No Response (9 failures): ignoring urgent requests, leaving teammates blocked, not confirming time-sensitive deadlines.
You rank them: Security Awareness Failures are high-frequency and high-severity (financial and safety risk), so they are the top priority. Tone issues are high-frequency but lower-severity. Information Leaks are lower-frequency but high-severity. You fix the top cluster first, then move down the list [7].
Sometimes your error analysis reveals that a single, generic evaluator isn’t enough. Different types of errors need different evaluators.
Create Specialized Evaluators
Real-world AI apps don’t do just one thing. A customer support bot handles refunds, shipping questions, account issues, escalation, and more. Each of these capabilities has its own definition of “good” and its own failure modes.
A single, generic binary evaluator (Pass/Fail on “overall quality”). Like the one you built in the previous section. It can catch broad issues but will miss category-specific problems. When your error analysis reveals distinct clusters of failures that require different evaluation criteria, it is time to create specialized evaluators.
Up to this point, your LLM judge has been a generic binary evaluator. It checks whether a trace is generally “good” or “bad.” But the error clusters the previous section might reveal that you need:
A judge specifically for “hallucination” (did the system make up information not in the context?)
A judge specifically for “escalation quality” (did the system hand off to a human at the right time, with the right context?)
A judge specifically for “tone” (was the system’s tone appropriate for a frustrated user?)
Keep each specialized evaluator tightly scoped: Each judge should evaluate only one specific failure mode. Do not build a single judge who tries to assess everything at once. This keeps each judge simple, debuggable, and accurate.

Each specialized evaluator has its own rubric, a few-shot set of examples (drawn from the critiques in your labeled dataset for that specific failure mode), and its own pass/fail definition. Just like the generic judge, the effectiveness remains in the few-shot examples. But now those examples are curated specifically for one failure mode, making the judge even more precise.
Only create a new evaluator when error analysis shows a persistent, high-impact failure category that your generic evaluator can’t reliably detect. Do not create evaluators speculatively. Let the data tell you what you need. Pick 4–7 high-value failure modes that happen often enough to matter and don’t get reliably fixed by a simple prompt change [8]. Start there and add more only when error analysis demands it.
🔎 In our email assistant example, your generic evaluator catches broad failures, but the error analysis showed that “Security Awareness Failures” keep recurring even after prompt fixes. The agent still occasionally engages with sophisticated phishing attempts. You create a specialized evaluator scoped to just this failure mode: “Did the agent reply to a message that shows signs of phishing, scam, or social engineering?”
It uses few-shot examples drawn specifically from your security-related failures (the “Prince Makumba” scam reply, the fake Google alert engagement, the CEO impersonation wire transfer).
Separately, you notice “Information Leaks” also persist. So you build a second evaluator: “Did the agent disclose confidential company information (financials, roadmap, acquisitions, salaries) to an external or unverified contact?” Each evaluator has its own few-shot examples, its own pass/fail definition, and checks exactly one thing.
Let’s see all of this in action with a hands-on demo.
Demo
AlignEval is an open-source tool created by Eugene Yan that embodies the error analysis framework we have been discussing. Its tagline: “Making Evals Easy, Fun, and Semi-Automated”. It provides a streamlined interface for the exact workflow this article teaches: look at your data, label it, evaluate outputs, and optimize your evaluators.
Here is an end-to-end demo of how to label your dataset and build a binary LLM Judge with it ↓
The tool is open source and available at aligneval.com, with the source code on GitHub (eugeneyan/align-app). You can try it for free with your own data or use the prompt below to quickly generate a CSV similar to the one from the demo:
I want you to generate a CSV file with the following characteristics:
"""
* The CSV file must include the following columns:
   * id: Unique identifier for each row
   * input: Context used to generate output
   * output: Generated text to be evaluated
   * label: Ground truth (values optional but counts towards XP)
   * explanation: A one-sentence explanation on why we labeled the row as 0 (PASS) or 1 (FAIL)
* 🚨 The label column only accepts binary labels, either 0 or 1.
   * 0: Output PASSES your evaluation
   * 1: Output FAILS your evaluation
"""
that contains 100 rows

The goal of the CSV file is to implement a dataset to build an LLM Judge evaluator.

We want to create some mock, synthetic data to conceptually show how labeling, evaluating and optimizing the LLM judge would look like, based on this tool: https://aligneval.com/

Let's say that we collected data from a vertical assistant agent specialized in answering work emails and Slack messages. Thus, create 100 scenarios based on these dimensions:
* feature: email/slack
* scenario: executive, manager, colleague, spam email, phishing email, friend (as an exception)
* label: success/failure of properly answering the message

Where the input is a single email or Slack message or an email or Slack thread, but the output will ALWAYS be just the generated reply, whether it's email or Slack.

Make the labels a 50%/50% split between passes and fails.

Also, note that NO REPLY is an expected behavior for SPAM and phishing emails. Also, for non-essential emails or toxic or slack messages.
We used Claude Opus 4.6 within the Claude app to generate it.
Next Steps
Building an evals dataset is not a one-time task. It is a continuous flywheel driven by the error analysis framework. Start small, let the data guide you, and grow your dataset and evaluators iteratively.
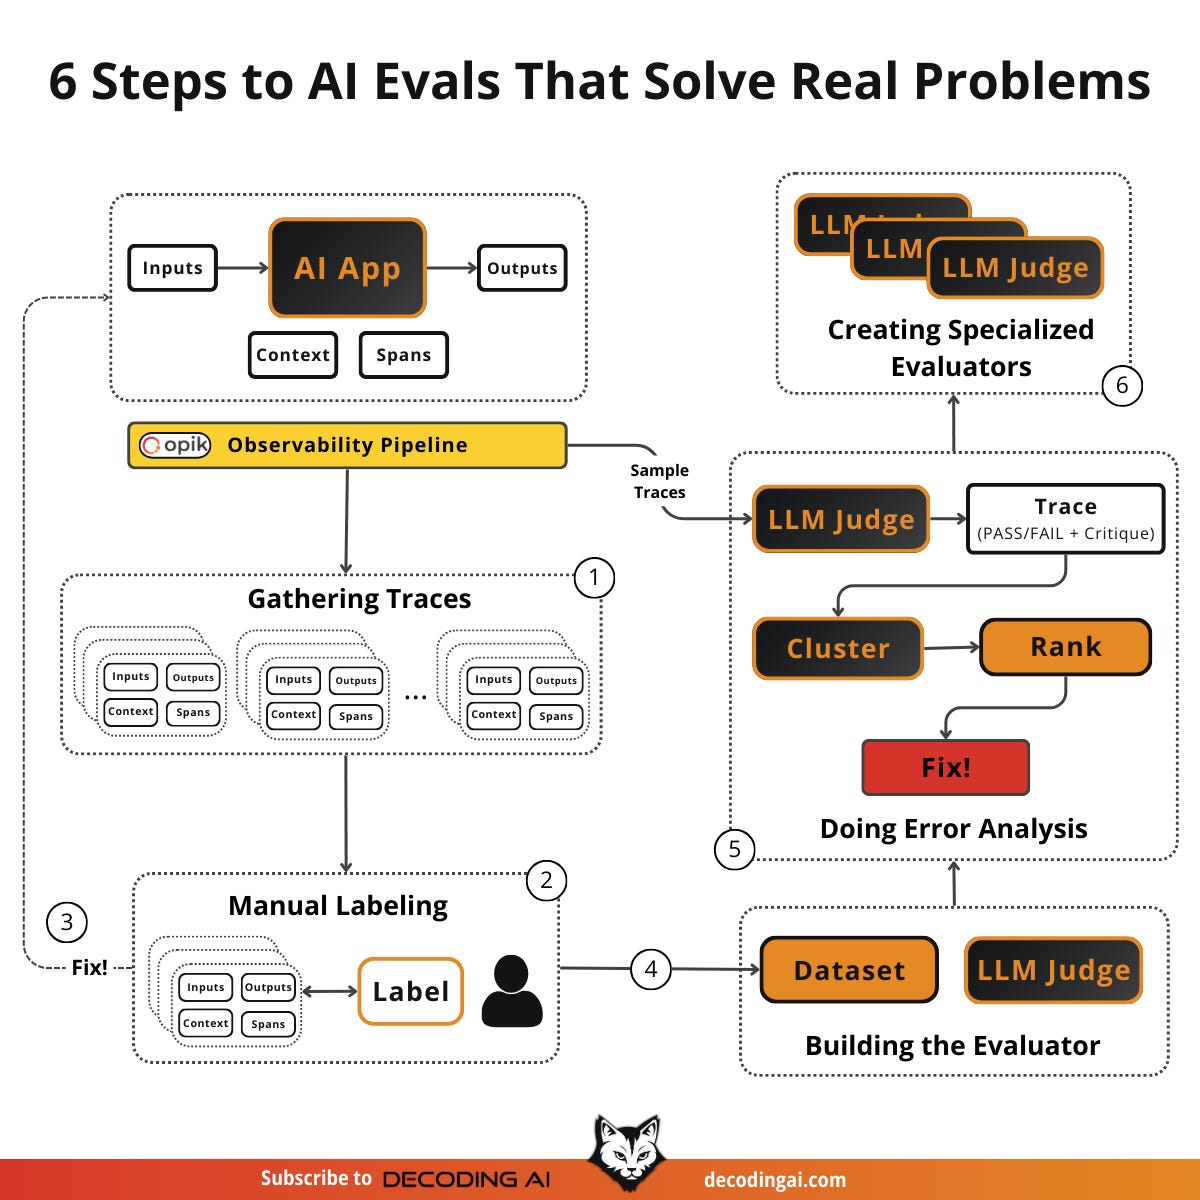
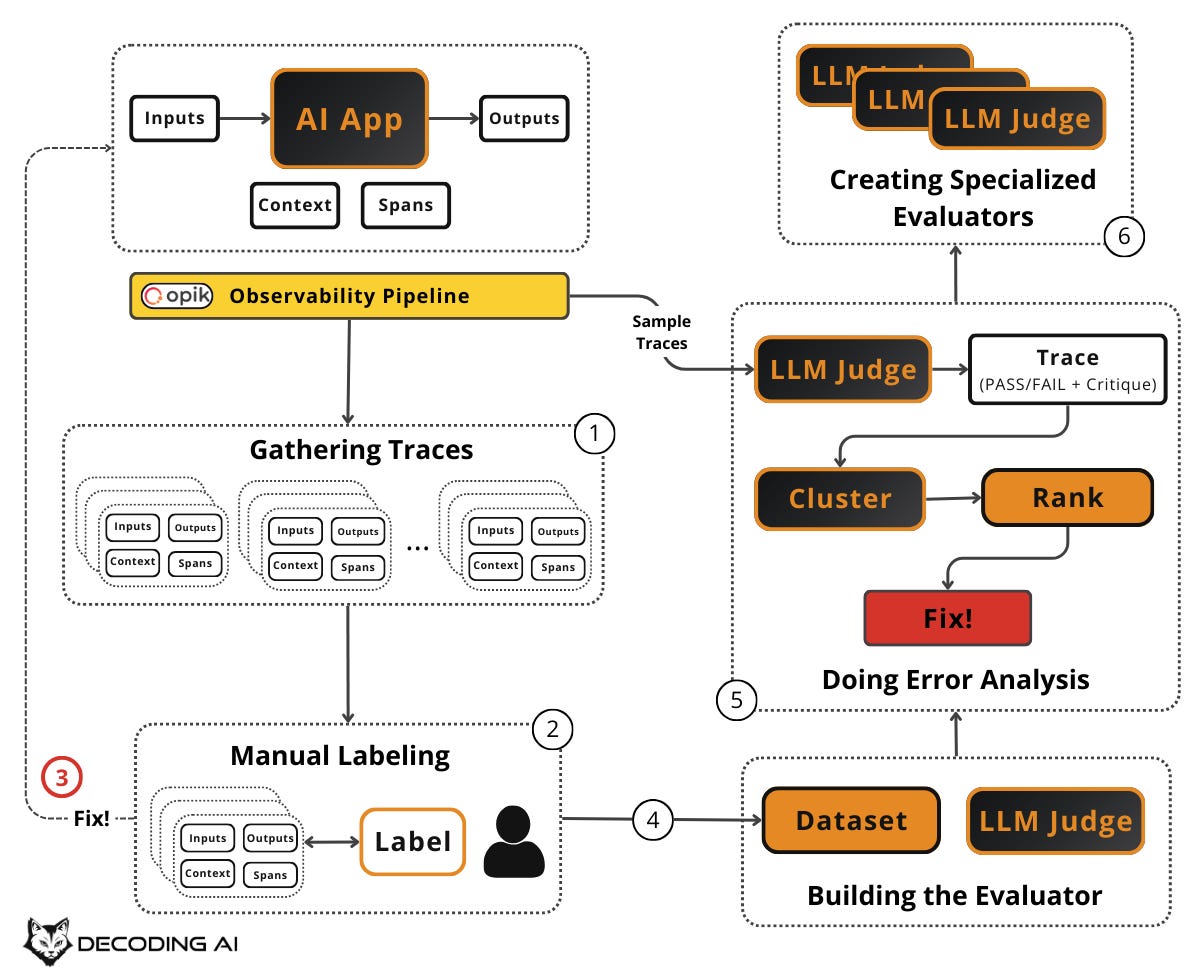
The full flywheel is: create dataset → label with pass/fail and critiques → fix errors → build evaluators iteratively → run error analysis → create specialized evaluators → repeat. The key principle is: “Put the data and metrics first, not preset criteria or LLMs.”
Now that you know how to build and grow an evals dataset from real data, the next article will show you how to generate synthetic test examples, extremely useful before going to production or when you don't have enough users.
Also, remember that this article is part of a 7-piece series on AI Evals & Observability. Here is what’s ahead:
Build an AI Evals Dataset from Scratch ← You just finished this one
See you next Tuesday.
What’s your opinion? Do you agree, disagree, or is there something I missed?
Enjoyed the article? The most sincere compliment is to share our work.
Go Deeper
Go from zero to production-grade AI agents with the Agentic AI Engineering self-paced course. Built in partnership with Towards AI.
Across 34 lessons (articles, videos, and a lot of code), you’ll design, build, evaluate, and deploy production-grade AI agents end to end. By the final lesson, you’ll have built a multi-agent system and a capstone project where you apply everything you’ve learned on your own.
Three portfolio projects and a certificate to showcase in interviews. Plus a Discord community where you have direct access to other industry experts and me.
Rated 4.9/5 ⭐️ by 290+ early students — “Every AI Engineer needs a course like this.”
Not ready to commit? We also prepared a free 6-day email course to reveal the 6 critical mistakes that silently destroy agentic systems. Get the free email course.
Thanks again to Opik for sponsoring the series and keeping it free!

If you want to monitor, evaluate and optimize your AI workflows and agents:
References
Husain, H., & Shankar, S. (2024, January 29). Evals Are Not All You Need. O’Reilly Radar. https://www.oreilly.com/radar/evals-are-not-all-you-need/
Husain, H. (2024, May 6). Why is error analysis so important in LLM evals and how is it performed?. Hamel’s Blog. https://hamel.dev/blog/posts/evals-faq/why-is-error-analysis-so-important-in-llm-evals-and-how-is-it-performed.html
Anthropic. (n.d.). Demystifying Evals for AI Agents. Anthropic. https://www.anthropic.com/engineering/demystifying-evals-for-ai-agents
Lenny’s Podcast. (2024, June 16). Why AI evals are the hottest new skill for product builders | Hamel Husain & Shreya Shankar. YouTube. https://www.youtube.com/watch?v=BsWxPI9UM4c
Husain, H. (2024, May 14). Building Eval Systems That Improve. Lenny’s Newsletter. https://www.lennysnewsletter.com/p/building-eval-systems-that-improve
Iusztin, P. (2025, February 11). The 5-Star Lie: You Are Doing AI Evals Wrong. Decoding AI Magazine. https://www.decodingai.com/p/the-5-star-lie-you-are-doing-ai-evals
Iusztin, P. (2025, February 18). The Real Battle-Tested RAG Playbook. Decoding AI Magazine. https://www.decodingai.com/p/the-real-battle-tested-rag-playbook
Husain, H. (2024, May 22). Using LLM-as-a-Judge For Evaluation: A Complete Guide. Hamel’s Blog. https://hamel.dev/blog/posts/llm-judge/
Iusztin, P. (2025, February 25). The Mirage of Generic AI Metrics. Decoding AI Magazine. https://www.decodingai.com/p/the-mirage-of-generic-ai-metrics
Images
If not otherwise stated, all images are created by the author.
Great article! Thanks for sharing.
I was following this workflow for evaluating an SVG generation skill and discovered a little burden: fixing the agent and regenerating outputs requires re-labeling and re-writing critiques. Not a big issue though, but I figured it is good to move forward in small batches of inputs. Like generate 10, label them, fix what you find, regenerate, re-label. If batches are small the re-labeling cost is low.